“Your scientists were so preoccupied with whether or not they could they didn’t stop to think if they should.” (Dr Ian Malcolm, Jurassic Park)
There is a scene in The Hitchhiker’s Guide to the Galaxy that has stuck with me for 40 years. An advance party of Golgafrinchams, conned into leaving their own planet by those that saw them as useless, are trying to colonise Earth 2.0 and one of their first tasks is to invent the wheel. An exasperated Ford Prefect, witnessing the focus group in action, tells them that “it’s the single simplest machine in the entire universe” only to be met with an equally exasperated chief designer who demands to know what colour it should be. The wheel in question is hexagonal.
Every time I have been stuck in a meeting listening to people arguing about the wrong thing – trying to tackle a minor issue when the more pressing problem remains unsolved, discussing trivial matters when whole systems are failing – that scene has played on a loop in my head. And it came to mind again recently when Michael Tidd tweeted about an update to the primary accountability guidance (p17):
As primary tests and assessments were cancelled in academic years 2019/20 and 2020/21 due to COVID-19 disruption, there will be gaps in the prior attainment data available to calculate primary progress measures in future years. This will affect primary progress measures when the relevant cohorts reach the end of KS2 in 2023/24 and 2024/25. We will be doing further analytical work and testing as we explore whether there are alternative options for producing primary progress measures in the affected years, and will announce our approach in due course.
I’ve been pondering this issue since 2020 when the first round of KS1 assessments were cancelled: how will progress be measured for cohorts without baseline data? And I settled on the conclusion that it wouldn’t be. If we could manage without progress measures in 2020 and 2021 then surely we could manage again in 2024 and 2025. But doubts were sown last year when the DfE published national KS2 results split by phonics prior attainment. The statistical release shows the percentage of pupils that either met the phonics standard in year 1 or year 2, or didn’t meet the standard at all, who went on to meet expected standards in reading and writing at KS2. Interestingly, the same link was not made between phonics and maths at KS2 but I’m willing to bet that pattern would be the same, which begs question: is this about phonics or is it about the type of pupils that pass the phonics?
The important point is that whilst the current year 4 and 5 do not have KS1 results, they do have phonics scores, which could, in theory, be used to establish prior attainment groups (PAGs) for the purpose of measuring progress. Once done, the method would be broadly similar to now: a pupil’s KS2 score would be compared to the national average KS2 score of pupils who scored the same in the phonics test in Y1. And, as Michael pointed out in his tweet, these cohorts also have EYFSP outcomes, which could be used as a baseline. And this is not without precedent. FFT calculate EY-KS1 VA/CVA scores and you may remember those transition matrices in the early versions of the Inspection Data Summary Report, which showed the proportions of pupils meeting or exceeding the early learning goal in, for example, reading that achieved expected standards or greater depth in the subject at KS1. Unlike the KS2 results by phonics prior attainment mentioned above, this measure was developed at school level and was used for accountability purposes (but, strangely, only lasted a year and was quietly dropped).
So, the DfE could use EYFSP data, phonics scores, or a combination of the two. But whichever prior attainment option they go for, the problems are numerous (and obvious).
First, year 4 and year 5 pupils may well have phonics scores but their experience of the assessment differed. Year 5 pupils took the test at the usual point in the summer of year 1 whereas year 4 pupils were assessed in the autumn term of year 2. This shouldn’t be a problem because progress is a relative measure, but let’s not forget that there was no new phonics check produced for the lockdown-affected cohorts (i.e. current year 3 and 4). Instead, schools were instructed to use a previous year’s check, which means that any baseline would not be truly comparable from one school to the next. For consistency, pupils would have to be pooled into groups according to which year’s check was used to assess them. I doubt that would be possible.
And then there is the question of accuracy. As everyone knows – even if not everyone wants to admit it – the pressure exerted by the accountability system can cause widespread distortion of results. Different types of primary schools – infant, first, middle, junior, all-through – may perceive statutory assessments differently. One school’s result is another school’s baseline. Sometimes we may want the highest results possible; other times there are perverse incentives to keep things low; and maybe it’s all a bit Goldilocks: not too hot, not too cold, just right. This is especially the case when the accountability system relies on teacher assessment.
If you’re in any doubt about the suitability of EYFSP results as a baseline, here’s the national distribution of total scores calculated across the 17 goals:
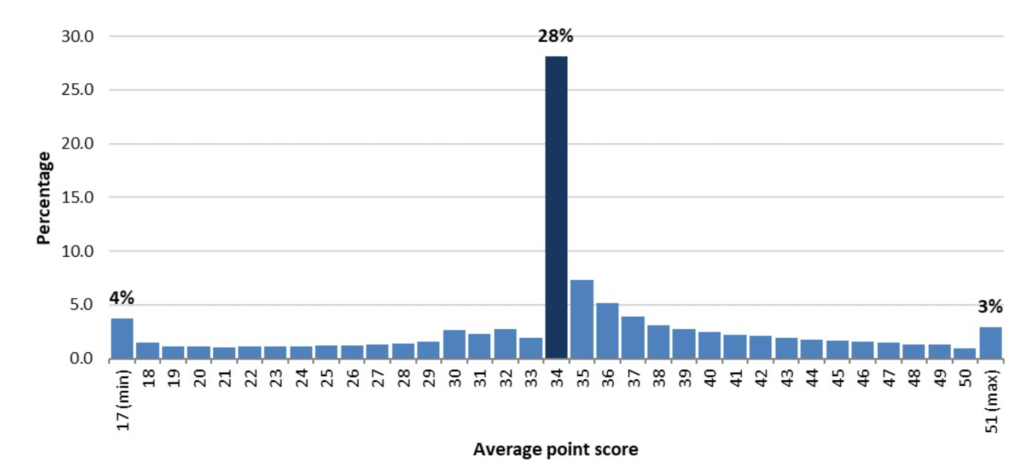
And here’s that famous graph illustrating the distribution of phonics scores:
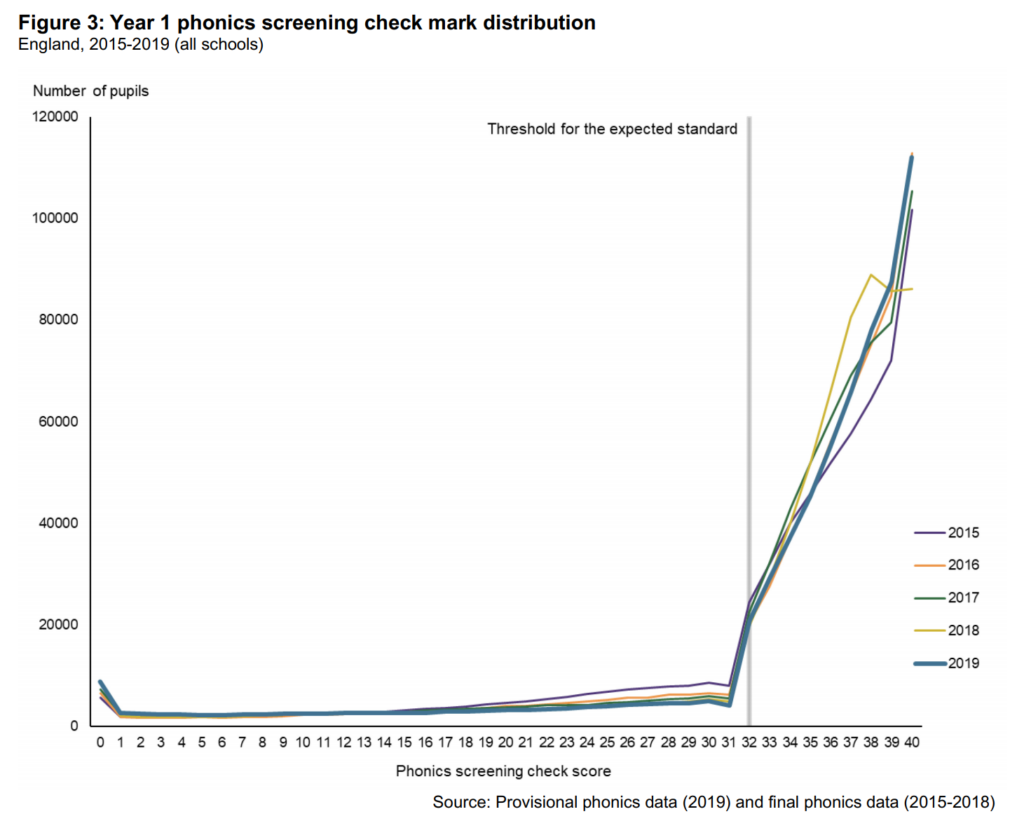
Does the limited range of these results, and the underlying issues of non-standardisation, bias and distortion (which affect KS1 assessment, too, by the way) make them ideal candidates for a baseline for such high stakes measures? Not really.
Then there’s the uneven impact of the pandemic to take into consideration: can we throw all these pupils into the same national pot and pretend that their experience during those lockdown years was the same and their prior attainment is therefore broadly comparable? Warnings about this uneven impact have been stamped all over recently published data (and rightly so) but these effects are not going to disappear next year. And let’s be honest, uneven effects are hardly new.
It is understandable that schools want progress measures. They are seen as fairer than attainment because they take a pupil’s start point into account but they can never truly be a measure of the school effect because there are so many variables at play, some of which are in the school’s control but most of which are not. The pandemic served to multiply and amplify these issues. The other rather inconvenient fact about progress measures is that they require a baseline. Whether we use KS1, phonics, EYFSP, or the Reception Baseline, the measure has to start somewhere, and no can decide where they want that somewhere to be.
Not only are progress measures difficult to calculate, create perverse incentives, are open to misinterpretation, and suffer from the inconvenience of requiring a baseline somewhere that no one wants, they are also a distraction. They can cause schools to play a numbers game, of getting pupils to the minimum grade or score required to break even rather than meet a required standard. Most target setting regimes are influenced by the supposed minimum thresholds of the national progress system, which risks detracting from the more critical purpose of getting all pupils to expected standards.
But we can’t just have attainment measures. How can that be fair?
Which brings me back to the colour of the wheel: we are focussing on the wrong thing. We coped without progress measures for 2 years during which time schools kept doing what they do and nothing terrible happened (well, nothing caused by the lack of progress measures anyway). Schools want progress measures because of the system we have, because of performance tables, and Ofsted, and ASP, and the way the data is used; because of a system we have come to accept as normal. But if we changed the system to one that is more supportive and less punitive then we wouldn’t need such abstract consolation measures that seek to distil a school’s ‘value-added’ down to a single number.
And we wouldn’t need to worry about fixing cracks in the system with statistical duct tape.
Bad data is not better than no data at all.