As in other industries, accountability in education is inevitable and necessary. The government wants to know if the vast sums of money involved are being well spent and whether or not its assessment reforms and new national curriculum are producing the desired results. Are national educational standards rising and are gaps between the most disadvantaged pupils and others closing? Ofsted, meanwhile, want measures of school effectiveness to feed into the inspection process, and, of course, parents want information to help them make choices about schools for their children.
This all sounds reasonable enough, but there are a few things to consider. First, national standards can be monitored through sampling; it doesn’t require collection of assessment data from all schools. In France, for example, the CEDRE assessments, which are administered at the end of primary and lower secondary education and involve several thousand pupils from a few hundred schools, are done for this purpose. Second, publishing data in the form of public performance tables generates competition between schools, which can have both positive and negative effects. The intended outcome of the performance tables is that they drive up standards and ‘a rising tide lifts all boats’ but they can also result in parents and teachers favouring one school over another. Once in motion, these social shenanigans can take years to reverse.
The problem with the performance tables is that few people really understand them. Most have no idea what a value added score means or how it is calculated; they just look at the colour orange and the words ‘below average’ and form an opinion about the school based on that. The landing page of the performance tables should be a contextual summary of the school, not rows of colour coded, abstract numbers.
The other problem with performance tables – and the high stakes nature of accountability in education – is that they can lead to the distortion of data, and this is especially the case when it comes to teacher assessment. At least Progress 8 – the key accountability measure of secondary school performance – is, despite its flaws, based on standardised assessment at each end: KS2 test scores and GCSE grades. Unfortunately, measures of primary school performance are – quite understandably – heavily reliant on teacher assessment and this is a big issue: teacher assessment is subjective and prone to bias and distortion.
Perhaps, following the two year hiatus in the collection of statutory assessment data, we have a chance to pause and reflect, to consider the purpose of assessment and how it responds to the stress placed upon it by the accountability system. There are now seven (SEVEN!) statutory assessment points in the primary education phase, and there are potential issues with each.
Key Stage 2
KS2 assessment involves a mix of tests (in reading, maths, and grammar, punctuation and spelling) and teacher assessment (of writing). Progress – currently the main indicator of school performance – is measured from KS1 to KS2 and comprises six elements: results in reading, writing and maths at KS1 (combined into a single baseline score), and results in the same three subjects at KS2 (which remain separate to produce a progress score for each subject). Four out of six of those elements are based on teacher assessment; only reading and maths results at KS2 are based on standardised tests.
The issues with writing at KS2 are well documented and concerns persist. In 2019, more pupils achieved expected standards in writing (78%) than in reading (73%) and greater disparities occur at LA level, which may suggest variable interpretation and execution of moderation guidance. It is worth noting that MATs can change their moderation arrangements and there is evidence to suggest that some academy chains are favouring certain local authorities over others. It is also worth noting that KS2 writing results no longer form a part of the baseline for progress 8; writing was stripped from the baseline in 2017 when the first cohort with teacher assessments in the subject sat GCSEs. In previous versions of Ofsted’s IDSR report, discrepancies in a school’s KS2 results could generate an ‘area for investigation’ to alert inspectors: ‘writing results in this school are unusually high/low in comparison with other subjects’.
It seems that everyone is aware that there are major reliability issues with writing assessment at KS2, and yet results continue to be used in key performance measures. It’s probably time that ended.
Key Stage 1
The perception of KS1 assessment may vary depending on the type of school. For infant schools it provides the final result before pupils move onto the next phase; for all-through primary schools KS1 assessment provides the baseline for future progress measures at KS2. We therefore end up with a situation where some schools may give the benefit of the doubt whilst others err on the side of caution. This creates a perfect storm for junior schools whose pupils have higher results on entry but have to meet KS2 benchmark scores that have been inflated by the depression of KS1 results in the dominant all-through primaries. A similar situation arises in first and middle schools and it is little wonder that schools in three-tier systems can feel like they are running to stand still.
As a consequence, warnings about these concerns are now printed on the performance tables and on IDSR reports of Junior and Middle schools:
We know from national data that pupils at junior schools, on average, have higher attainment scores at the end of key stage 2 than pupils at all other primary schools. However, on average, they also have lower progress scores. This may be for a variety of reasons and should be taken into account when comparing their results to schools which start educating their pupils from the beginning of key stage 1.
But this is scant consolation for those working in such schools when the statement is merely a footnote to the main data that suggests progress is below or significantly below average.
The point is this: if there is a concern about the reliability of KS1 results affecting Junior and Middle school data then there must be concerns across the board. We have just had two years without progress measures due to the lack of KS2 results in 2020 and 2021; and we will have a further two years without progress measures in 2024 and 2025 when cohorts at the end of KS2 have no KS1 results. KS1 assessment is due to be scrapped in 2024 when the first cohort of children with reception baseline scores reach the end of Year 2 and considering the holes we already have in the accountability record, why not scrap it now?
Multiplication Tables Check
Not due to become statutory until June 2022, it’s too early to say how this will pan out but the writing is on the wall. Originally mooted as a low stakes assessment, the framework, published in 2018, states that data will be used in the following ways:
- school-level results and individual pupil results will be made available to schools. This will allow them to provide additional support to pupils who require it
- as is the case with the Phonics Check, school-level results will be available to selected users including Ofsted via the Analyse School Performance (ASP) data system
- national results will be reported by the Department for Education (DfE) to track standards over time
- national and local authority results will be reported by the DfE to allow schools to benchmark the performance of their pupils
Points 2 and 4 are probably of most concern because whilst there is no pass mark, schools are being encouraged to benchmark pupils against local and national results, and data will be made available to Ofsted who will no doubt use the data to generate ‘areas of interest’ statements in the IDSR and place schools into performance quintiles. This is a long way from a low stakes assessment.
Phonics
A picture paints a thousand words so lets let the famous graph showing the national distribution of phonics scores do the talking.
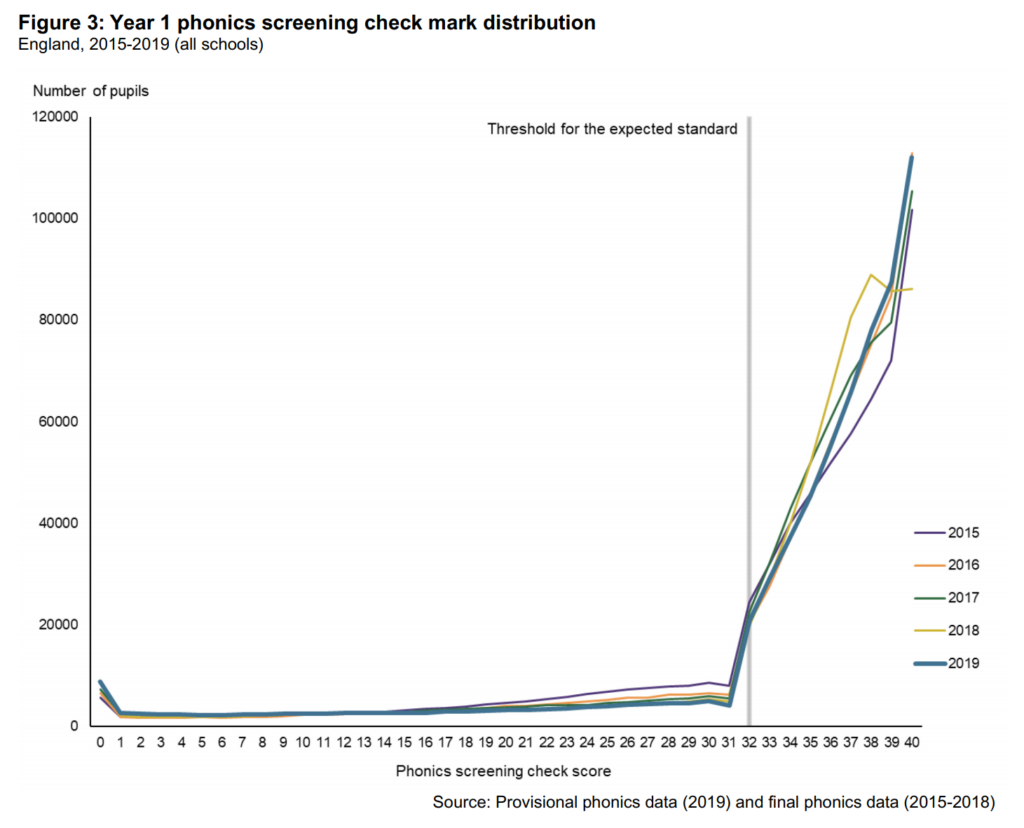
Almost exactly the same number of pupils achieve marks 1 to 30. There is then a weird dip at 31 before it pitches up like the Eiger-Nordwand at mark 32. Everything about this graph is odd and it begs the question: would it still look like this if no one collected the data?
Early Years Foundation Stage Profile
There was a time when the EYFSP was sheltered from the distorting effects of accountability but that ended when those involved in school challenge and improvement started to compare results with those at KS1. Whilst there is no official progress measure between EYFS and KS1 – and EYFSP data is not published in the performance tables – the link between the two points is frequently made. This culminated in data in the IDSR that showed the percentage of pupils meeting the early learning goal (ELG) in reading, say, going on to achieve expected standards in reading at KS1; or the percentage that exceeded the ELG in writing that managed to achieve greater depth at KS1. This data has been stripped out in the latest versions of the IDSR but the damage is done. It is little surprise that a headteacher might wryly suggest they’d “best not have too many exceed the goals in future” or that an LA advisor would recommend erring on the side of caution.
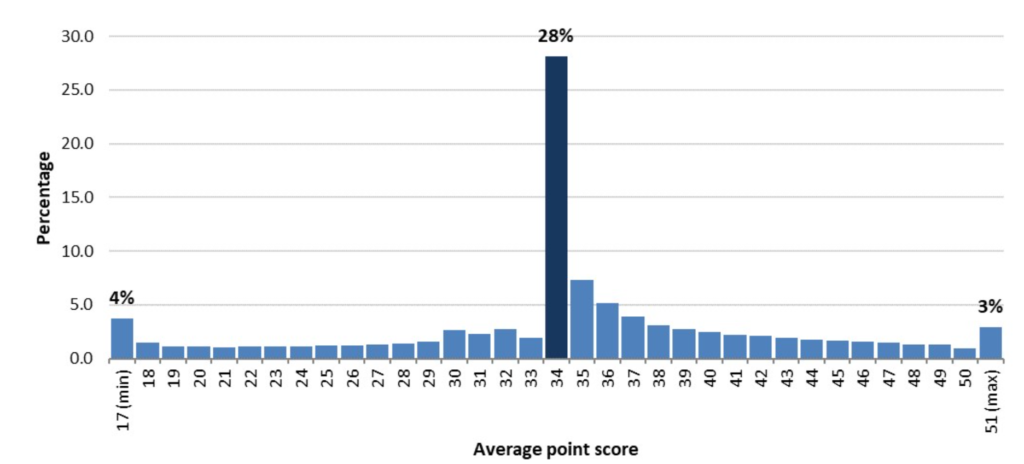
Such external influence and concern about accountability measures can reduce assessment to a Goldilocks-style process and maybe that partly explains why the distribution of EYFSP total points scores looks like this:
Reception Baseline
The long delayed rollout of RBa V2.0 happens this term and will eventually replace KS1 results as the baseline for primary progress measures in 2028. Originally intended to be a multi-provider approach, that idea was scrapped when an SQA report revealed that the results from the various baseline assessments (NFER, CEM, and EEx) were incomparable (who knew?). The latest version (from NFER) has had a stuttering start with a trial year in 2018/19, a pilot year in 2019/20 and the scheduled statutory rollout in 2020/21 year instead becoming an ‘early adopter’ year. Finally, during the first half term of 2021/22, pupils in the reception year will undergo this one-to-one, task based assessment, the scores from which will be locked away from sight – although they will follow pupils if they change schools – and only used to place pupils into prior attainment groups once they have completed KS2.
The reasoning behind the RBa is twofold: 1) it enables progress to be measured from the start of statutory education rather than from KS1, which is nearly halfway through the primary phase, and 2) it is a standardised assessment with set tasks and scripted questions, which aims to address concerns about the current baseline i.e. the broad and subjective nature of KS1 data.
Besides the obvious workload concerns and potential accessibility issues, there is one glaring anomaly in the way the baseline is being implemented and, yet again, it involves non-all-through primary schools. Infant and first schools will have a statutory duty to administer the baseline but will have no progress measures based on it because KS1 assessment is due to be scrapped. This means that junior and middle schools, who will have KS2 results but no KS1 data, will also be without progress measures. Instead, these schools will be responsible for demonstrating progress to Ofsted and others using their own assessment information. All through primary schools, on the other hand, will continue to have progress measures, now calculated from the start of reception rather than the end of KS1.
This leaves us with an unequitable – and perhaps unsustainable – system in which performance measures used to hold schools to account and the perception of the value and purpose of the baseline varies depending on the type of school. This 2015 research report from the DfE raises the spectre of ‘gaming’:
A variation in approaches to administering the reception baseline, and in the extent of ‘gaming’, could have an impact on the reliability of the data which will be used for accountability purposes.
And, whilst inconclusive, framing of the baseline did lead to differences in results: schools that were told the baseline was for accountability purposes (i.e. progress measures) had lower scores than those schools who believed the assessment was for teaching and learning.
The DfE will therefore have to invest a lot of time and energy in developing processes to identify potential cases of ‘gaming’, and have people in place to investigate them. Is it worth it?
Conclusion
To reiterate the point made at the top of this post, accountability in education is inevitable and necessary. The problem is that most of the accountability measures used to assess primary school performance are based on teacher assessment and the fact is that that data can be manipulated. The accountability system distorts the very data it relies upon to function.
The final report of the Commission on Assessment without Levels and the Making Data Work report both warn that linking assessment data to the performance management of teachers risks undermining the purpose of that assessment and the integrity of the results. The same applies at school and national level. We cannot be surprised that data becomes distorted as the pressure exerted upon it increases. This is the elephant in the room that we’ve long been aware of but haven’t addressed: that EYFSP, phonics, KS1, MTC, and KS2 writing assessments should play no part in the accountability regime.
The inconvenient truth is: you can have reliable teacher assessment or you can use it for accountability.
That’s the choice.