One of the most common questions I get asked is ‘how do we show the progress of those pupils working below their year group?’ Historically, this would have been done using some kind of points system linked to stages of the curriculum – each increment being worth 0.5 or 1 point with average points calculated for each cohort and group of pupils, including those with SEND. But with levels gone (they have finally been flushed out of the primary system this year), most schools are moving away from such levelesque systems and adopting simpler ‘are they on track or not?’ approaches. Schools seem comfortable with this for pupils continually assessed as on-track or above, but they get nervous about those that are ‘stuck’ in the below band.
For pupils working below, they often want to maintain a points-based system to ‘show the progress’ of the pupils in this group. This can then be shown to governors, LA advisors, and those further up the chain in a MAT as an aggregated average (“the group have made this many steps on average this year”). Teachers know the progress these pupils are making and could no doubt talk about it at length and demonstrate it through the work in pupils books, but all too often the lack of data is an inconvenience to those scrutinising school performance who expect the neatness of numbers. Numbers based on abstract, non-standardised measures that are, quite frankly, meaningless. The data exists solely to keep other people happy.
When it comes to data for this group of pupils, schools have a number of choices:
- Invent some kind of system of sublevels. Although no longer ubiquitous, this is still very common. Schools are happy with having a few bands to accommodate the vast majority of pupils (eg working towards, expected, and above) but have numerous subdivisions for those working below (eg below ARE-1, -2, -3 and -4, and significantly below). These act as a series of steps (levels?) that pupils are expected to move up through, but the temptation is for teachers to put them in a low band at the start of the year and move them into a higher band at the end to ‘show progress’. Moreover, the criteria for each band is often extremely flaky – based on a check list of curriculum statements and arbitrary thresholds – or even non-existent, resulting in assessment that is at best highly subjective, and at worst guesswork.
- Use the pre-key stage criteria. This is understandably attractive – it seems standardised in that it is based on a published framework – but it’s also highly problematic. First, pre-key stage assessments are designed to be used at the end of key stage 1 and key stage 2, and not for ongoing assessment. And if you do use them for ongoing assessment, you’ll find you have gaps in your system. Pre-key stage standards 1-4 are used to indicate that a pupil is working below the standard of key stage 1, whilst pre-key stage standards 5-6 are used to indicate that the pupil is working below the standard of key stage 2. But what happens if you have a pupil in year 5 that is working 2 years below? Neither PK1-4 (below KS1) nor PK5-6 (below KS2) would work. This then leads schools to invent other bands to fill the void, such as ‘Below ARE -2), But what if you have a pupil in year 3 that is working a year behind? Are they PK6 or ‘Below ARE -1? It’s messy, confusing, and extremely ineffective.
- Use a more meaningful assessment such as a reading age test; and show change in reading age over time. This has the benefit of being based on a standardised assessment and is therefore something that can be measured. A school could show the gap between reading age and chronological age; and change in reading age (in months) over a period of time. Average reading age for various pupil groups could also be calculated, compared and tracked.
- Don’t bother. Just accept that the data shows that they are working below and anyone who wants to know anything about the progress these pupils are making should ask. A conversation with the teacher and a look at the pupils’ books will provide the insight into their progress.
Many schools will go for number 4, but for some schools that is easier said than done: some data is required. However, as stated, the first two approaches have serious issues, and attempting to use averages (eg average reading age or average standardised test score) for such a group is flawed when we consider the likely diverse nature of a group with many different needs. Averages mask much of the story of these pupils.
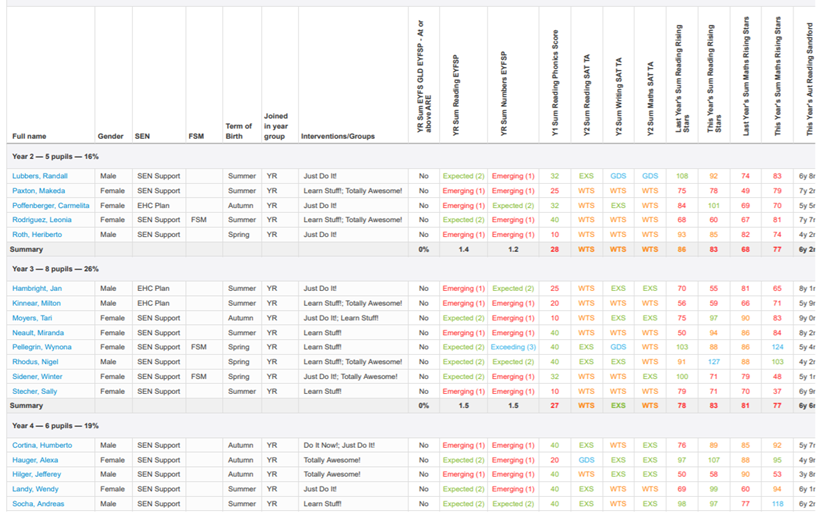
My advice to schools wanting to use data to demonstrate the progress of pupils working below their year group is to present anonymised pupil-level tables that provide contextual and assessment data over time. This is far more useful than presenting assessment data of one type, and certainly more useful than attempting to present averages for pupils with SEND as a group. The example table below* shows data for pupils with SEND in years 3, 4 and 5 in a primary school (not a real school!). Contextual columns show gender, disadvantaged, term of birth, SEN status (primary need would also be useful – good to see that making a comeback in the IDSR), and interventions that the pupil is receiving (none listed in the table). This is followed by assessment data: EYFSP, Phonics, KS1, standardised test scores, teacher assessment. These are just examples; other useful data may include reading ages over time, scaled scores from KS1 and other tests, and age standardised scores. Obviously, to present this to governors, names would need to be removed.
When it comes to pupils ‘working below’, the question of what data to use and how to present it is a tricky one but made-up metrics, single assessment points, and group averages are not the answer. A range of measures involving multiple assessments overtime, alongside individual contextual factors is far more informative and should equip those tasked with monitoring school performance with a richer source of information from which to draw more meaningful questions.
*Table built using Insight table tool, which allows users to select columns of data and group as required.