Using on entry CAT tests in junior schools (and how I intend to buy new climbing shoes)

Some things in life are certain: death, taxes, getting a ‘sorry I missed you’ card from the postman when you’ve just nipped to the loo for 2 minutes. Oh, and having the conversation about the accuracy of infant schools’ KS1 results whenever you find yourself in the same room as a junior school headteacher. This is a conversation I have regularly. If I had a pound for each time I’ve had this conversation, I reckon I’d have about £87 by now, which is nearly enough for a new pair of climbing shoes. I always need new climbing shoes.

I’m going off topic.

Sometime ago, a junior school head came to visit me in my office. She wanted to discuss the issue of KS1 data accuracy (obviously). I pushed my jar of pound coins towards her, strategically placed a climbing gear catalogue within line of sight, and prepared myself for some proper headteacher ranting. But this head didn’t want to rant; she wanted to take some action. She wanted to do stuff. She wanted data. Which is always nice.

So, after some discussion we hatched a plan: to carry out CAT tests on entry in as many Junior schools as possible. We had no idea if this project would be of any use and what we would do with the data when we got it but it sounded like positive action and we thought it would be pretty neat, too. In the end after numerous meetings and emails, 13 out of the 20 junior schools in Gloucestershire got involved and a date in early October was set for their new Year 3 intakes to do the tests. Exciting!

The test itself is known as a PreA test and is specifically designed to be carried out early in year 3. If you’d like to learn more about these and other CAT tests, please contact GL Assessment.

I said above that we didn’t know what we would do with the data, which is really true. I had a sort of, kind of idea. A CAT test provides scores for the pupils verbal, non-verbal and quantitative reasoning; it does not generate a level or sublevel that can be directly compared with the pupil’s KS1 results. However, like other CAT tests, the PreA test would provide an English and Maths estimate for the end of KS2 in the form of a sublevel. I thought it would be interesting to compare these estimates with those generated using RAISE VA methodology. Not exactly a perfect solution, but compelling, in a data-ery sort of way.

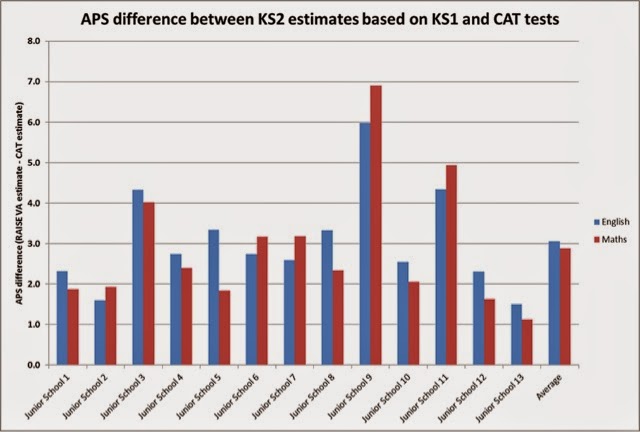
So, once the junior schools had carried out the PreA tests in October last year, they sent me the data. I then converted each pupil’s KS2 sublevel estimates generated by the tests, into points scores (by the way, I don’t like using the term ‘APS’ here because they’re not averages. I’m pedantic like that). Next I put each pupil’s KS1 results into my VA calculator (more information on that here) to generate end of KS2 estimates using RAISE VA methodology, and took estimated point scores for each pupil. I now had two point score estimates for the end of KS2 for each Y3 pupil in the 13 junior schools taking part: one based on the CAT PreA test; the other based on their KS1 results. Neat! now all I had to do was subtract the CAT estimate from the RAISE VA estimate (the former from the latter) to find which one was highest. Positive figures would indicate that the estimate derived from the CAT tests was in advance of those derived from KS1 results; negative figures would indicate the opposite. ‘So what?’ I hear you shout. Fair question, but bear in mind that it’s the RAISE VA estimate that the pupil’s progress is measured against (well, sort of, because, actually, their estimates won’t really be calculated until they’ve done their KS2 SATS, but we’re trying here, OK?). And if the RAISE VA estimate (i.e. that based on KS1) is always higher that the CAT estimate then this could be rather worrying as it may indicate that the future VA bar will be set unrealistically high for those pupils.

So what was the outcome?

Well, the estimates based on KS1 results were higher than the those based on the CAT test in pretty much every case. I’m writing this at home without the full dataset in front of me but we’re talking about approximately 600 pupils here. It was quite startling. Wanna see some data? Course you do.

EnglishMaths
Junior School 12.31.9
Junior School 21.61.9
Junior School 34.34.0
Junior School 42.72.4
Junior School 53.31.8
Junior School 62.73.2
Junior School 72.63.2
Junior School 83.32.3
Junior School 96.06.9
Junior School 102.52.1
Junior School 114.34.9
Junior School 122.31.6
Junior School 131.51.1
Average3.02.9

The table and chart above (it’s always nice to have the same data presented in different ways – I learnt a lot from RAISE) show the average differences (this actually is APS!) between the end of KS2 estimates derived from CAT PreA tests and those generated using RAISE VA methodology for both English and Maths. I used 2012 methodology, by the way, as it produced English estimates, rather than the separate reading and writing estimates of 2013, and so matched the CAT test data. As you can see the average difference for the group of schools is 3 points for both English and Maths, i.e. VA estimates base on KS1 outcomes are 3 points (1.5 sublevels) higher than those based on the CAT tests. Some schools’ differences are very small (e.g. schools 2 and 13), so estimates based on KS1 and CAT tests are similar and this could be taken as evidence that KS1 results are accurate. And maybe differences of 2 APS or less are the within the limits of tolerance, but three of the above schools (3, 9 and 11) have very big differences and these perhaps are the most concerning. Schools 3 and 11 have differences of 4-5 APS (2-2.5 sublevels) and school 9 has a difference of 6 APS in English and 7 APS in Maths (an entire level).
Obviously I’m making the assumption that CAT tests are reliable and accurate predictors of end of key stage outcome, but if this is the case (and many evidently think they are), and if the estimate differences detailed above can be taken as a proxy for the gap between KS1 results and pupils’ actual ability, then the children in these three schools in particular have some serious ground to make up just to break even in terms of VA. Considering that, on average, cohorts need to make around 13 points to get a VA score of 100  (it’s actually around 13.4 but let’s not split hairs), then the pupils in the schools 3 and 11 would, in reality, need to make 17 points to make expected progress (in terms of VA). Meanwhile pupils in school 9 will need to make 19-20 points to reach the VA 100 line. Somewhat unlikely and blue boxes in RAISE may be hard to avoid. Interestingly, my friendly junior school head teacher, mentioned above, maintains that pupils in her school need to make 16 points of progress in reality (i.e. from the school’s own baseline assessment) to get a positive VA score. The CAT vs VA experiment backed up her assertions.
So, that’s it really. Deeply flawed I know, but interesting and a worthwhile exercise (the data was used by one school as part of their evidence base for inspection and proved very useful). The lack of control group is an obvious issue here and needs to be addressed in future. Ideally we’d like to get 10 primary schools to take part at some point. Traditionally schools have carried out CAT testing in Year 5 but more schools are considering alternatives. I actually think it’s worth doing them earlier as you have more time to act on the data, so perhaps more primary schools would be interested in testing in year 3. Many of the junior schools heads involved in this project intend to continue using the tests as it gave them a alternative and rich source of information on pupils strengths and weaknesses, which they didn’t have previously. This is a positive thing.
And finally, please can I state that this is not intended to be an exercise in infant school bashing. I’m very fond of infant schools, some of my best friends are infant schools, but this issue always crops up when talking to junior schools so I thought it would be interesting to test their claims. I suspect that similar issues occur in primary schools and that’s why we need a primary control group for this research to have any real validity.

Anyway, that’s the end of this blog. Hope it was useful, or at least interesting.

Oh, and by the way, I am now a governor of a junior school and now own new pair of climbing shoes.

Subscribe to receive email updates when new blog posts are published.

Share this article

Leave a Reply

Your email address will not be published.

© 2024 Sig+ for School Data. All Rights Reserved.