SEND is always a focus, and perhaps now more than ever. Barely a day goes by without the publication of another article, and the news is rarely good. Just look at the pages of SchoolsWeek over the past month: budget cuts, delays in assessment, a shortage of educational psychologists, councils facing bankruptcy, and SENCOs under increasing pressure as a consequence. The Guardian has also been reporting on the issues in funding and support. It’s little wonder that the words ‘SEND’ and ‘crisis‘ are never far apart.
This blog post is not an opinion piece. I’m not qualified to make judgements about the issues affecting SEND provision (although, as a school governor, I obviously have major concerns). Rather, this post will simply present some data to provide context. I’ve broken the data down into three areas: numbers, attendance (including suspensions and exclusions), and attainment.
All data is sourced from the DfE’s Explore Education Statistics website.
Numbers
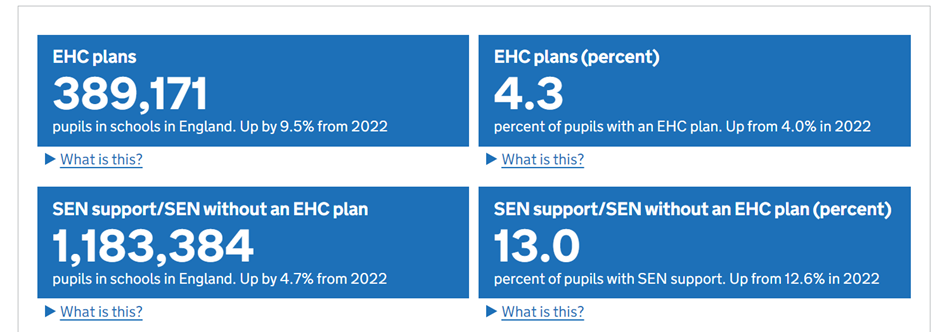
First, let’s take a look at the numbers of pupils with SEND. In 2023, there were 389,171 pupils with EHCPs and 1,183,384 pupils on SEN Support in schools in England. These figures represent 4.3% and 13% of the pupil population and have increased by 9.5% and 4.7% respectively since 2022.
If you want to go further back in time, and see the breakdown by phase, here are the numbers and percentages of pupils with SEND in total and in primary and secondary schools since 2015.
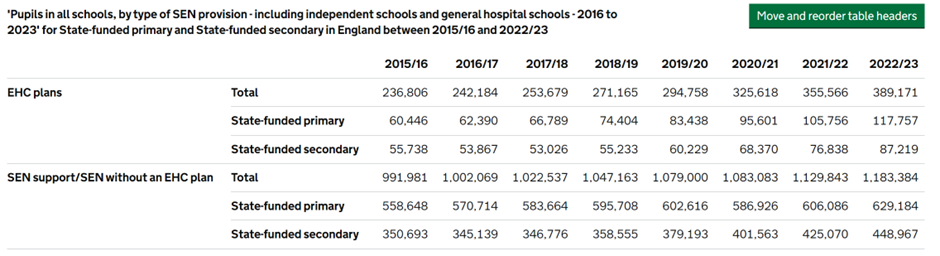
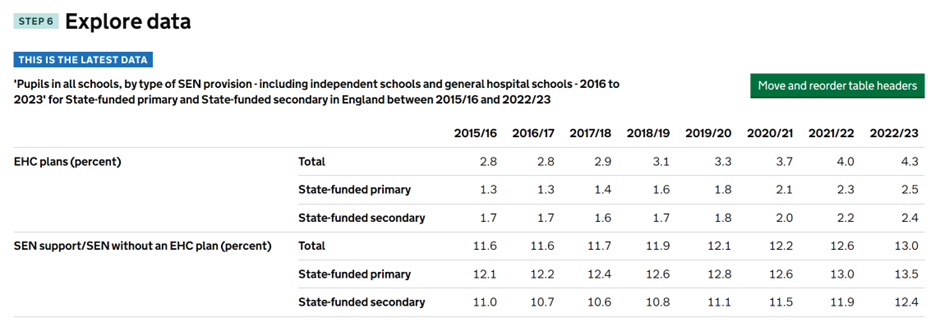
Looking at the change in the percentage of pupils with SEND over time doesn’t really tell the story. Of more interest is the percentage change in numbers, and it’s worth noting that the number of pupils with EHCPs has increased by 64% overall, and by 95% and 56% in primary and secondary schools respectively. This is either due to better diagnosis or increasing need or both.
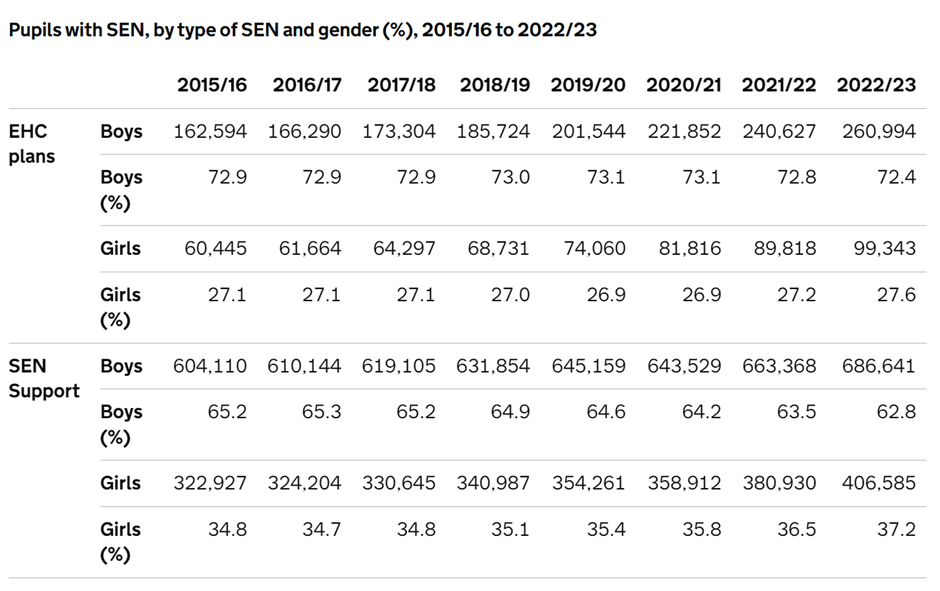
And if you’re wondering how this breaks down by gender, the following table reveals that nearly three quarters of pupils with EHCPs almost two thirds of those on SEN Support are boys.
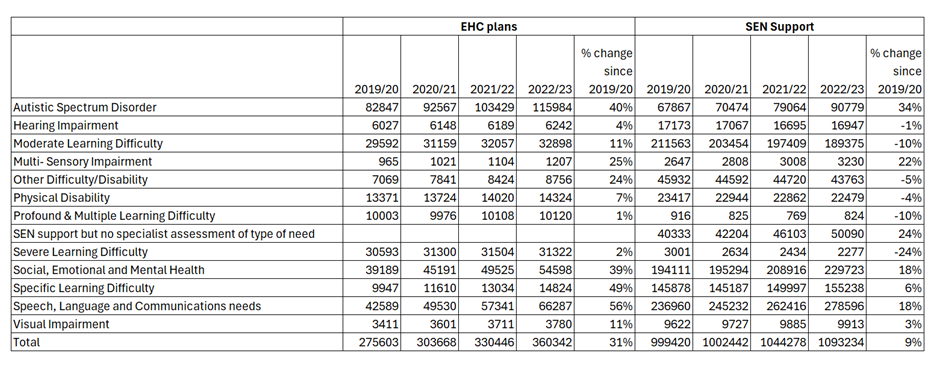
On the subject of need, the following table shows the numbers of pupils by specific type of SEND and the percentage change since 2019/20. This is an interesting period of time because it straddles the pandemic. Here we can see EHCPs increasing in each area but particularly for ASD, SEMH, SLD, and SLCN. As we saw in the previous tables, the numbers of pupils on SEN Support have not increased by as much in percentage terms, and in some cases have actually decreased. Again, ASD, SEMH and SLCN are seeing the biggest increases; and also worthy of note is the increasing number of pupils in the ‘SEN Support but no specialist assessment of type of need’ category.
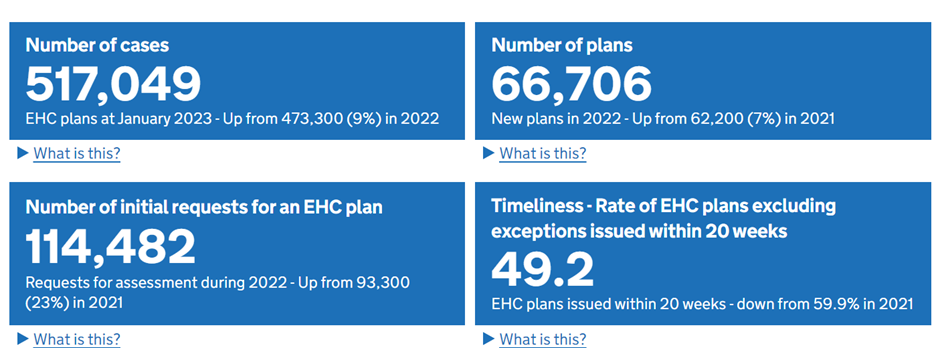
It’s also worth looking at assessment. Here we can see that the number of cases has increased but that the percentage of plans issued within 20 weeks has decreased by 10 percentage points since 2021.
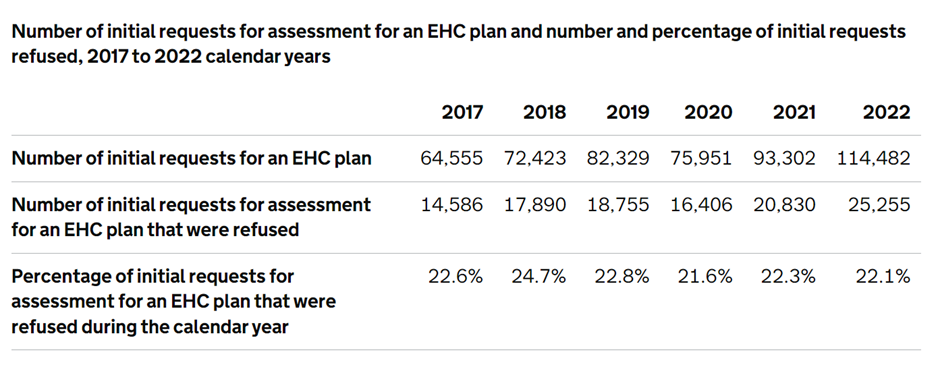
The rate of refusal for EHCPs remains around 22% but requests have increased by 77% since 2017, and up by 23% since 2021.
Attendance
FFT Education Datalab wrote this excellent article on attendance with reference to the new thresholds issued by the government. The data shows that a higher proportion of pupils with SEN will be affected by the measures than those without SEN. I definitely recommend it.
Here, I’ve taken the latest attendance data (autumn term 2023/24), which the government collects live from schools MIS, and compared it to previous autumn terms to get an idea of if and how the situation is changing.
NB: I’m not sure why there are ‘No SEN’ figures for special schools but EES generates the figures so I’ve left them in. I assume they are very small numbers.
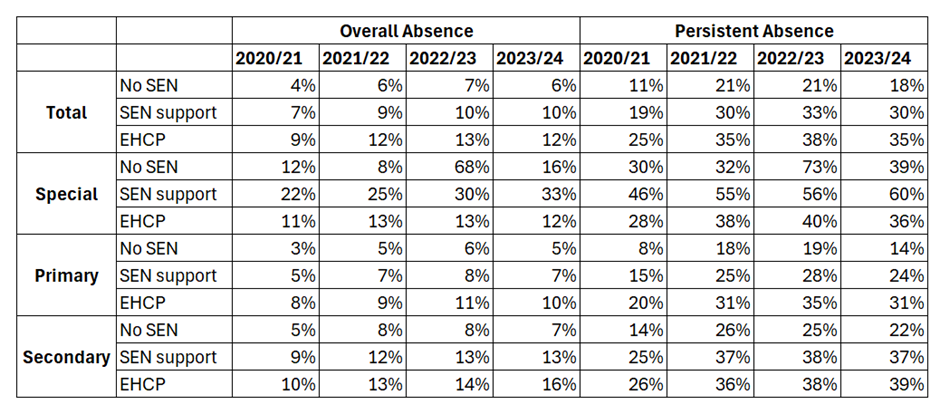
Rates of overall and persistent absence of pupils with SEND (both SEN Support and EHCP) remain high (double the rates of the No SEN group in the case of EHCP) and have increased since 2020/21 in most cases, although it should be noted that both overall and persistent absence rates have fallen in primary schools compared with autumn 2022/23. Overall, around a third of pupils with SEND are classified as persistently absent (missing 10% or more sessions) and this rises to almost 40% of pupils with EHCPs in secondary schools. Also of note are the high absence rates relating to pupils on SEN Support in special schools. Despite some pockets of improvement here and there, the picture of attendance remains very concerning.
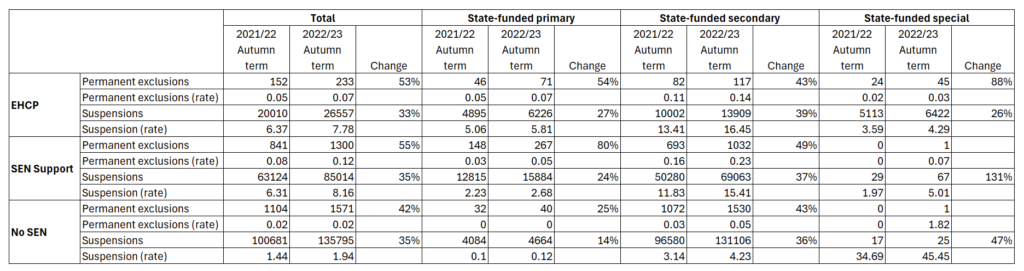
Exclusions and suspensions
Rates of exclusions are very low but numbers have increased markedly since Autumn 2021/22. The suspension rate is far higher for pupils with SEND than for those without, especially in secondary schools, and again the numbers have increased between autumn 2021/22 and autumn 2022/23. However, it should be noted that the percentage increase in suspensions in secondary schools across the period is broadly the same for the EHCP, SEN Support and No SEN groups. Meanwhile, in primary schools, there is a greater increase in suspensions for pupils with SEND than for those without. The key message here, therefore, is that there appears to be a greater likelihood of suspension for pupils with SEND and that numbers are increasing, but the increases are in line with those seen in the non-SEN population.
Attainment
Now let’s look at the results from various statutory assessments: phonics, key stage 1 (now optional), key stage 2, and GCSEs. Note that assessments were cancelled in 2019/20 and 2020/21 due to the pandemic. Phonics assessments were moved to the following autumn term but the national results for those years have not been published.
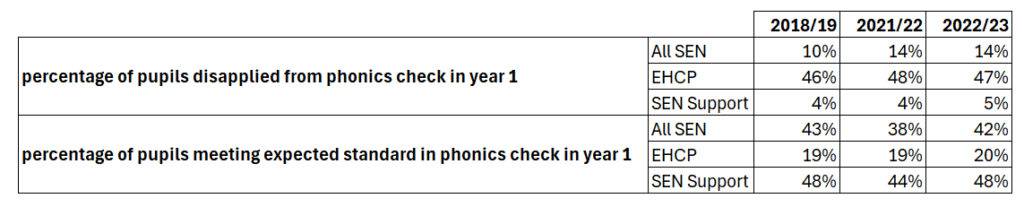
Starting with the phonics check, the percentage of pupils with SEND disapplied from the assessment increased after the pandemic but has remained stable for the last 2 years. The percentage of pupils on SEN Support achieving the expected standard in 2022/23 increased by 4 points compared with the previous year, bringing the result back up to the pre-pandemic level. The percentage of pupils with EHCPs achieving the phonics standard remains at around 20%. For context, around 80% of pupils achieve the phonics standard each year nationally.
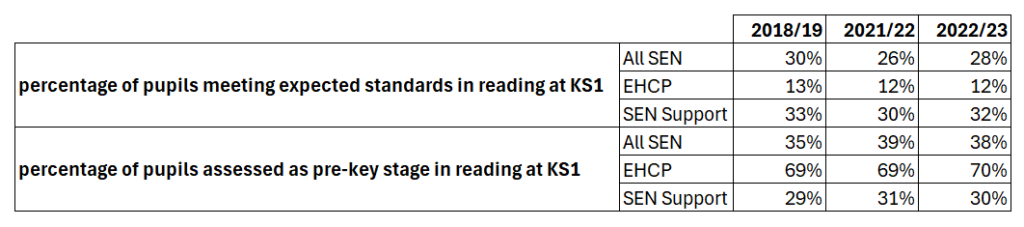
Key stage 1 (KS1) is no longer a statutory assessment but we have national results up to 2022/23. The following table focuses on results in reading at KS1 and shows that the percentage of pupils with SEND achieving expected standards has improved slightly since 2021/22 and that the proportion of pupils assessed as pre-key stage* has remained fairly consistent over time, but more pupils with SEND are assessed as pre-key stage than meet expected standards. For context, 68% of all pupils nationally achieve the expected standard in reading at KS1 in 2023.
*pre-key stage indicates that the pupil is working below the standards of the KS1 curriculum
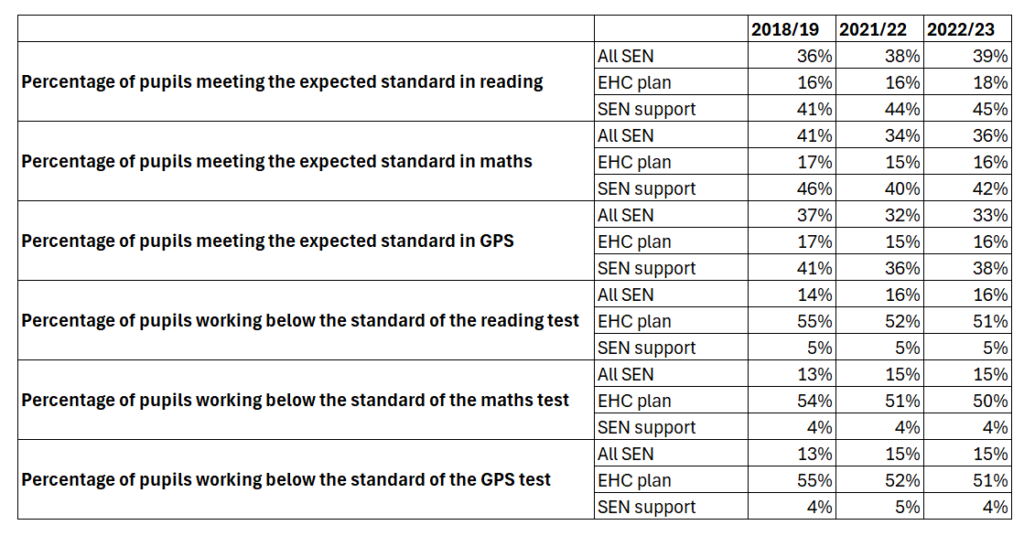
At key stage 2 (KS2), the percentage of pupils with SEND achieving the expected standard in reading has improved since 2018/19, whilst, in maths and GPS (grammar, punctuation and spelling) results fell in 2021/22 (post-pandemic) and then recovered slightly in 2022/23. Less than 20% of pupils with EHCPs achieved expected standards in 2022/23, which was similar to previous years; for those on SEN Support, over 40% achieved expected standards in each subject. Around 15% of pupils with SEND were working below the standard of the test (i.e. were unable to access them), a proportion that has remained constant over the past three years. This breaks down to around 4% of pupils on SEN Support and half of pupils with EHCPs. These pupils count in school results as having not achieved expected standards. For context, the percentage of pupils achieving expected standards in 2023 was 73% in reading and maths, and 72% in GPS.
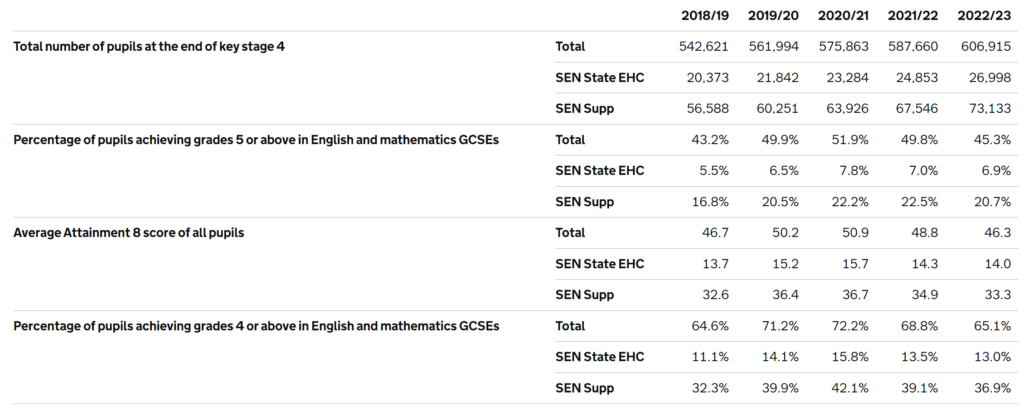
Key stage 4 results show an increasing number of pupils with SEND, especially those on SEN support. The percentage of pupils with EHCPs that achieved a grade 4 in English and maths is down slightly compared with 2021/22 but is 2 points higher than 2018/19 (pre-pandemic). The results of pupils on SEN support has also increased compared with pre-pandemic levels.
Note: Centre assessed grades (CAGs) were used in place of exam results in 2019/20 and 2020/21
Summary
First the good news. The pandemic doesn’t appear to have adversely affected the results of pupils with SEND too much, and in some cases, results have improved on pre-pandemic levels. But other metrics are clearly a cause for concern. The numbers of children with SEND – especially those with autistic spectrum disorders; social, emotional, and mental health issues; and speech, language and communication needs – are rising and waiting times for assessment are getting longer in many areas of the country. Attendance is a big problem for this vulnerable cohort of children – around a third of pupils with EHCPs are persistently absent from school – and exclusions and suspensions have increased. Meanwhile, budgets are tightening and the pressure is being felt in schools and by parents. No doubt, we will be seeing many more articles about the issues facing SEND provision in the coming months.