I’ve recently been posting a series of infographics of Ofsted inspection data on my timeline. This has prompted a lot of discussion so I thought it would be useful to publish them all in one place here.
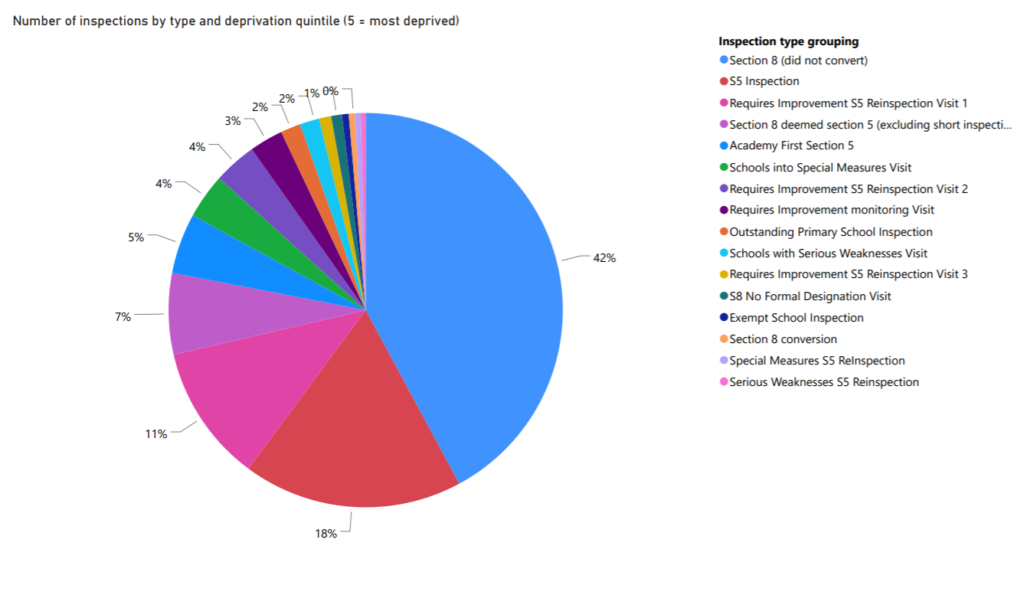
First, here’s a breakdown of the various categories of inspection that have taken place under the new EIF so far this year. The large blue segment accounts for Section 8 (did not convert) inspections and the red segment relates to section 5 inspections.
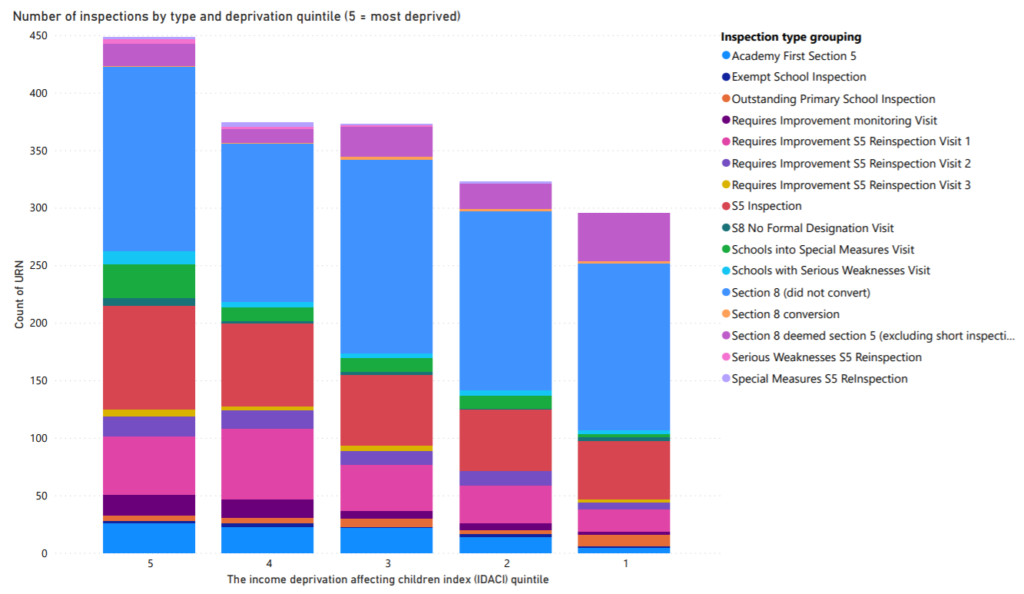
The following chart shows the number and type of inspection since September 2019 for schools in each deprivation quintile:
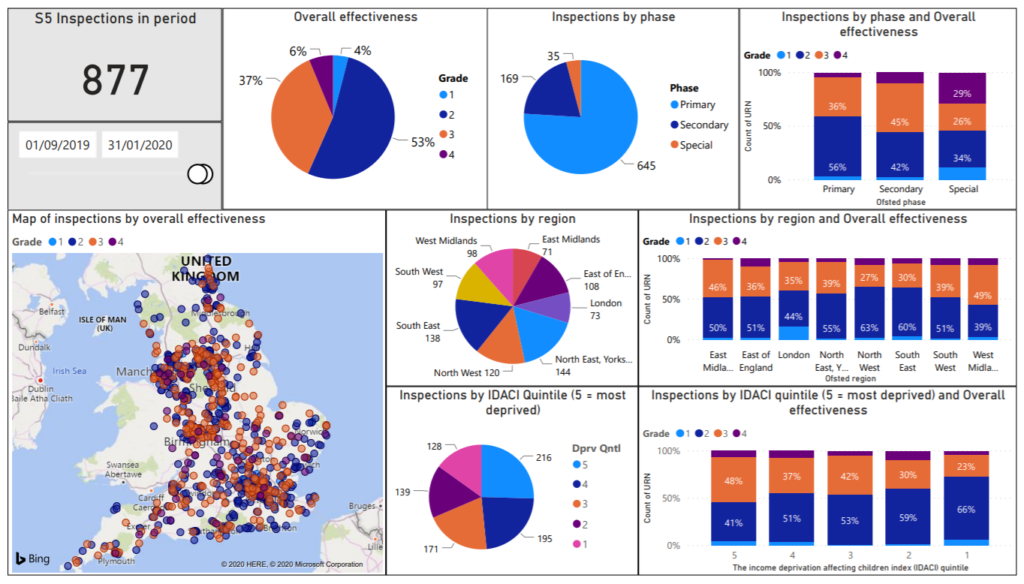
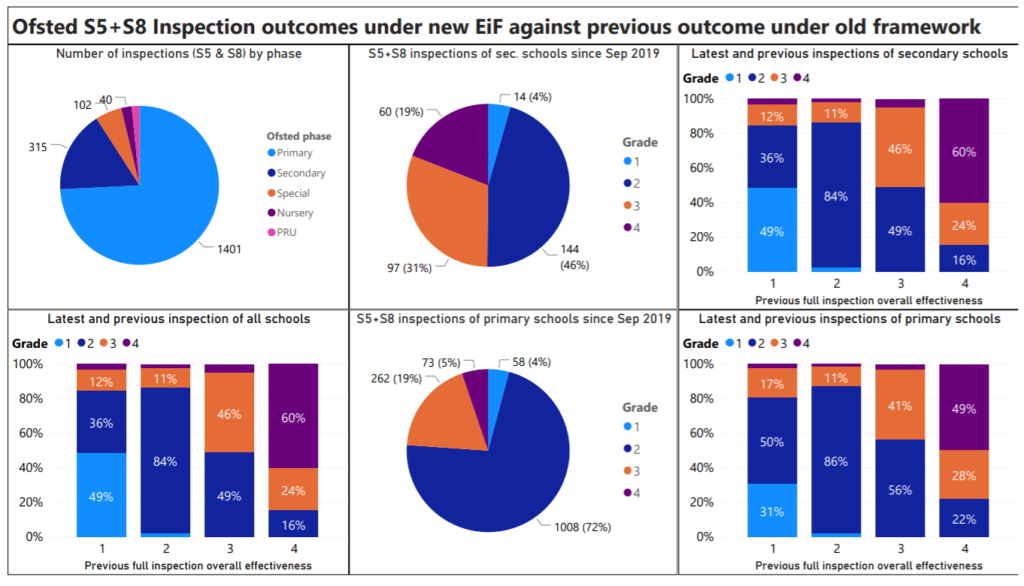
This infographic shows the results of section 5 inspections (including S8 conversions and S8 deemed S5) between September 2019 and January 2020, broken down by phase, region and deprivation quintile.
And here’s same infographic for same period last year:
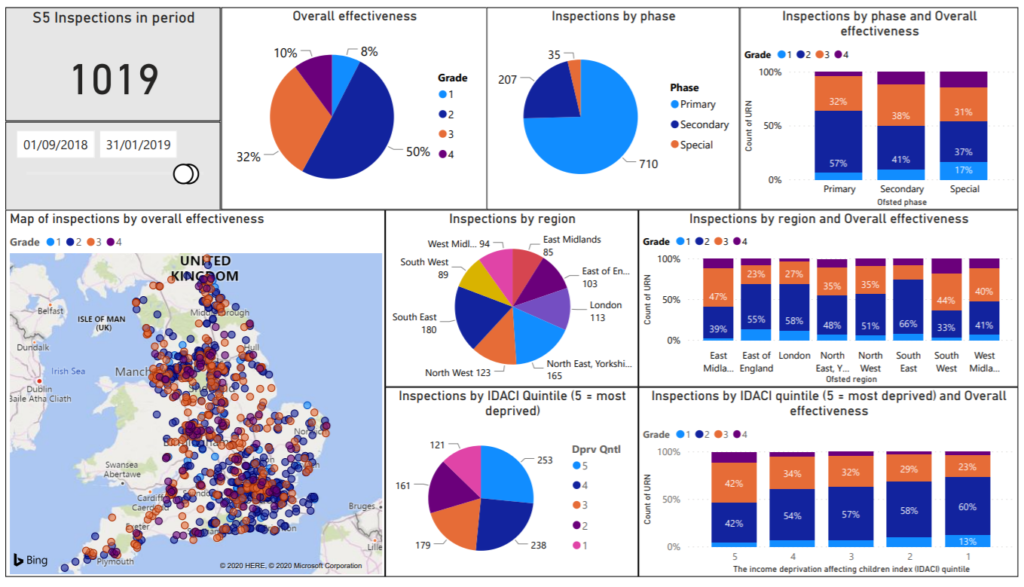
There are fewer schools graded outstanding or inadequate, but also an increase in RI outcomes, especially in more deprived areas.
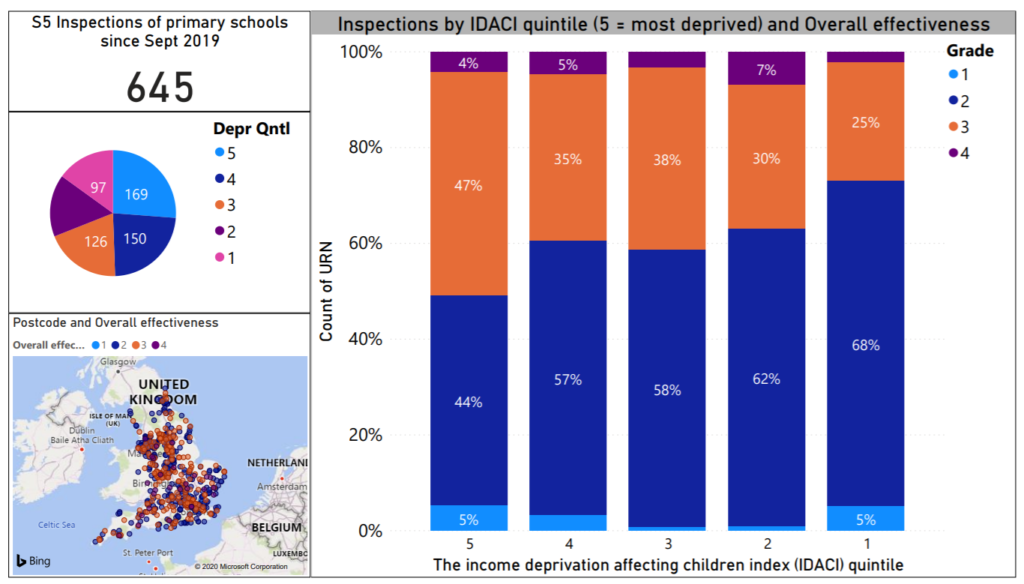
As there is clearly a lot of interest in the breakdown by deprivation quintile, here’s a look at primary schools only (pie chart shows number of S5 inspections for each deprivation quintile):
And here’s the same information for secondary schools:
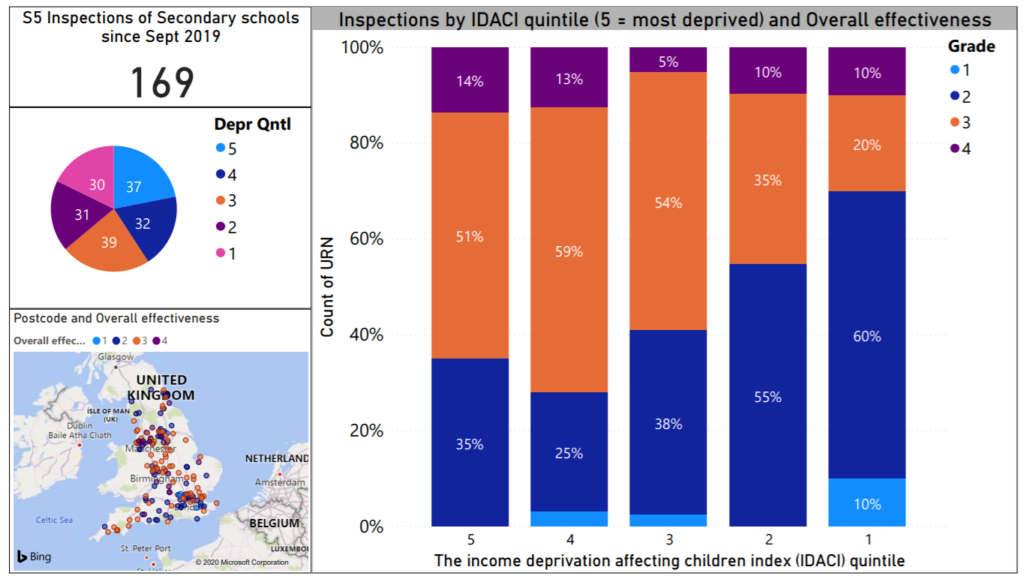
In both cases there are more cases of RI outcomes in areas of high deprivation but for secondary (note small numbers) it’s Q4 that has the highest concentration.
However, when we look at grade change between previous inspections under old frameworks and latest inspections under EIF, things look a bit different. This chart shows the proportions of schools maintaining their previous grade (purple), those going up a grade (pink and lilac), and those dropping by one or more (orange and blue). The data includes section 5 inspections where grades can change, and section 8 inspections where grades are maintained:
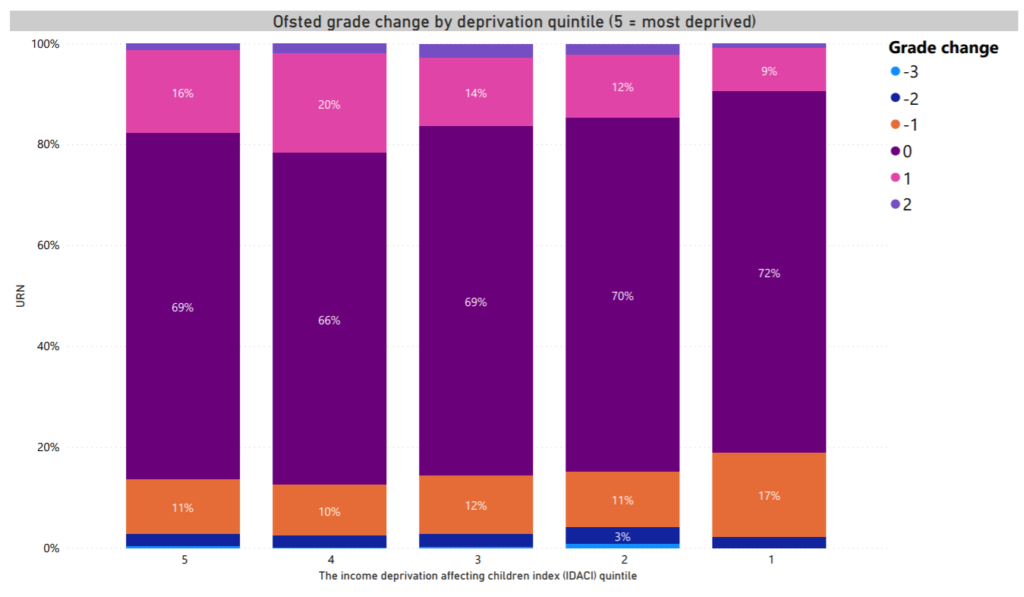
Here we see a greater proportion of schools dropping down a grade in areas of lowest deprivation. Inspections of previously outstanding schools are likely to account for some of this.
Building on the theme of ‘grade change’, the following infographic shows latest full (S5) inspection outcomes plotted against previous full inspection outcomes. For example, we can see that just 16% of previously outstanding secondary schools maintained their grade, and a far smaller proportion of previously outstanding primary schools did so. This is perhaps to be expected as usually exempt outstanding schools are targeted for inspection due to concerns. Perhaps of more concern is that the chance of maintaining a good judgement under a section 5 inspection appears to be around evens.
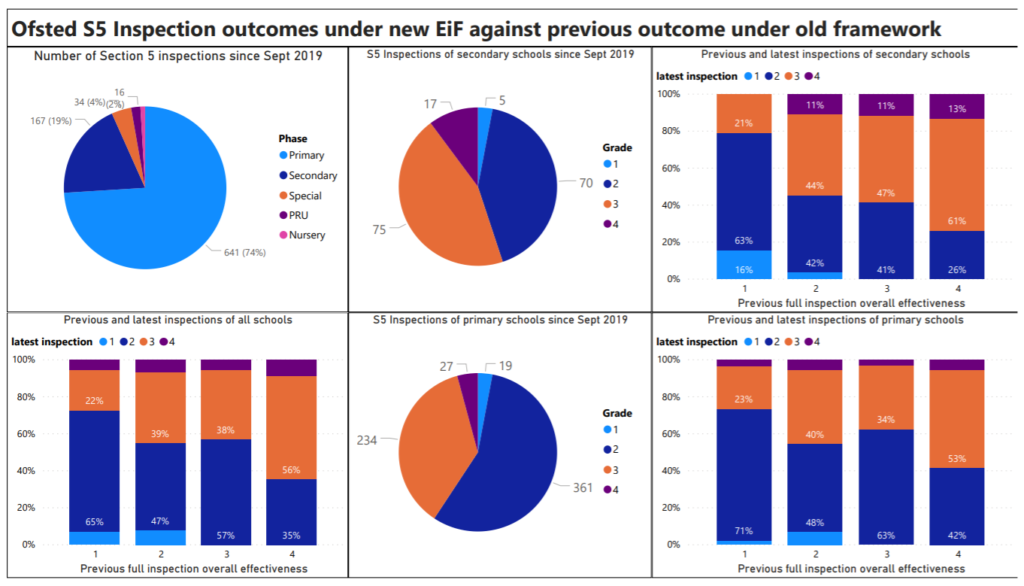
If we factor in the outcomes of section 8 inspections that have taken place this year, the data looks quite different with – as expected – more schools maintaining the judgement of their previous inspection. Approximately half the schools judged outstanding under a previous framework maintained that grade under the new EIF, and more than 4 out of 5 previously ‘good’ schools remained so.
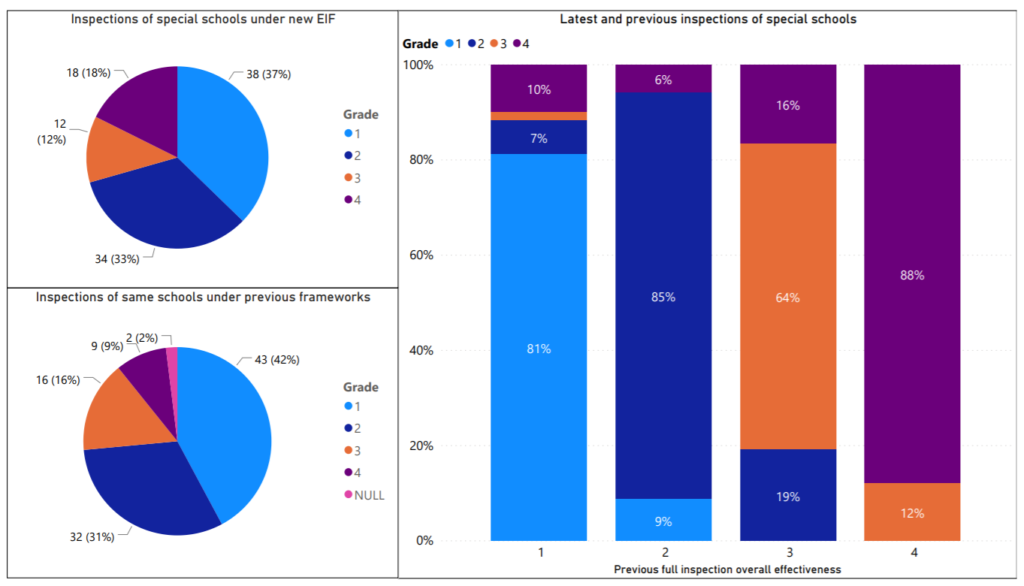
Whilst there have been only 102 inspections of special schools so far this year, here is some data on those. Generally it’s a story of grades maintained.
And finally, someone asked for a breakdown of inspections schools in London specifically, so here it is:
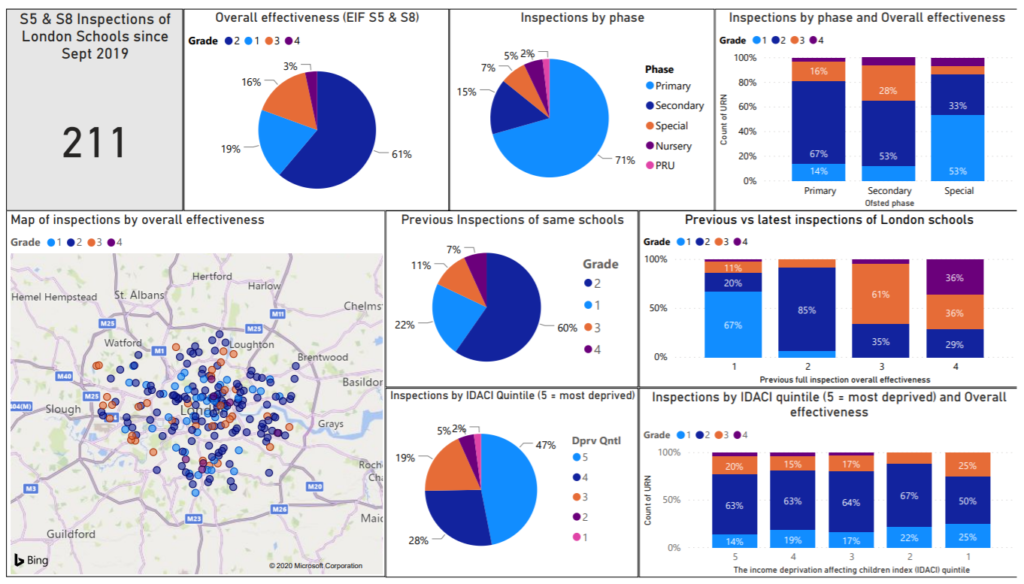
Note that this involves both S5 and S8 inspections and is not therefore comparable with the infographics above. There have been only 79 full inspections of London schools since September, which is not enough to produce anything meaningful. I’ll update the other infographics to include section 8 inspections when the next batch of data is published, although monitoring outcomes of section 5 inspections specifically is worthwhile as those can change the result of the previous inspection.
Anyway, I hope this melange of data is of some interest. Next I’ll add in results and census data from performance tables to provide more context.