Many schools are using standardised tests from the likes of NFER, GL and Rising Stars to monitor attainment and progress of pupils, and to predict outcomes; and yet there is lot of confusion about how standardised scores relate to scaled scores. The common misconception is that 100 on a standardised test (e.g. from NFER) is the same as 100 in a KS2 test, but it’s not. Only 50% achieve 100 or more in a standardised test (100 represents the average, or the 50th percentile); yet 73% achieved 100+ in the KS2 reading test in 2023 (and the average scaled score was 105). It is not possible for 73% of pupils to achieve a score of 100+ on an NFER test because a score of 100 on such tests is always the average.
The difference is that standardised tests are norm referenced – a normal, bell curve distribution centred on 100. KS2 tests are (sort of) criterion referenced – 100 is linked to criteria and there is no quota on how many achieve it. The scores, whilst looking remarkably similar, are actually very different, as the following distributions show:
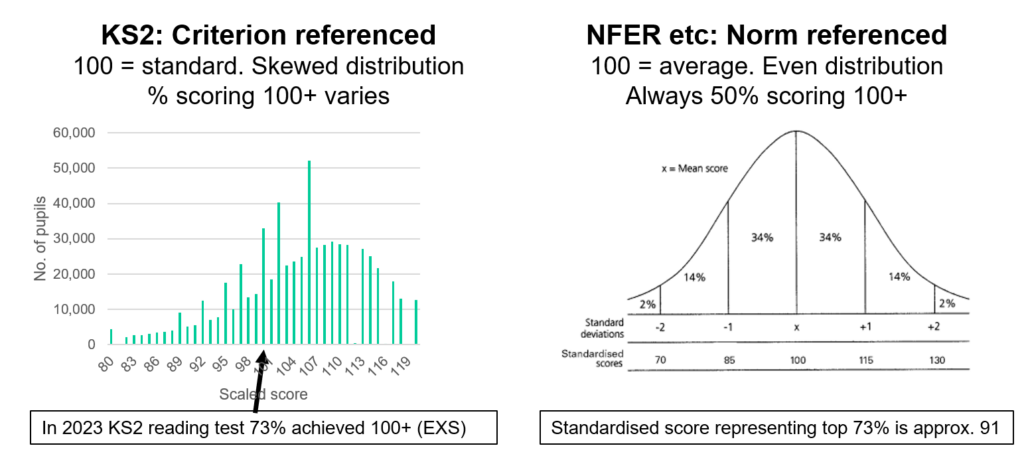
If we want a standardised score that better approximates expected standards we therefore need one that captures more pupils i.e. a lower score. We could set our threshold at 91, which would identify those in the top 73% nationally (and would match the 2023 KS2 maths pass mark) but this is rather low and somewhat risky as it could include a lot of borderline pupils. Therefore I recommend opting for 94 (top 66% – recommended by Rising Stars) or 95 (top 63% – the default in Insight) to be on the safe side. One would expect that pupils achieving scores that place them into the top two thirds nationally on standardised tests should have a good chance of achieving expected standards – getting into the top three quarters – at the end of KS2.
Whatever you do, please bear in mind that standardised test scores are not a prophecy of future results; they are simply an indicator, and may not correlate strongly with KS2 scores.
I have written a blog on the pros and cons of standardised tests here, and Michael Tidd (@ MichaelT1979) has also written an excellent blog post on the subject, which I recommend you read if you are using standardised scores for tracking.
The purpose of this blog is to share a conversion table, which will give you a rough idea of how scaled scores convert to standardised scores. It is based on distribution of 2023 KS2 scores in reading and maths, taken from national tables. Download the national, local and regional tables (3rd link down) and click on table N2b. The cumulative percentages in table N2b are converted to standardised scores via this lookup table.
The scaled score to standardised score conversion table can be downloaded here.
Please note: this is not an exact science and is intended as a guide – it will also change next year, when 2024 national data is released – but hopefully it will demonstrate that standardised scores and scaled scores of apparently equal value are not the same.
Enjoy!