As well as providing a super-simple, highly-customisable tracking system for individual schools, Insight also offers an equally intuitive reporting tool for MATs. Called Mosaic, this clever system allows MATs to build reports that pull all their key data together in one place: current teacher judgements, standardised tests, results of statutory assessments, pupil contextual information, and more. Just add a section, set the filters, decide what data to include and the format you want the data displayed in, add a comparator, and off you go. The report will then show results for each school in the MAT, as well as an overall MAT average figures, in a neat, easy to read table. Best of all, you don’t have to request these reports, you just build them yourself, and you can have as many as you like. Here’s a quick guide to building one.
Log in to Insight for your trust
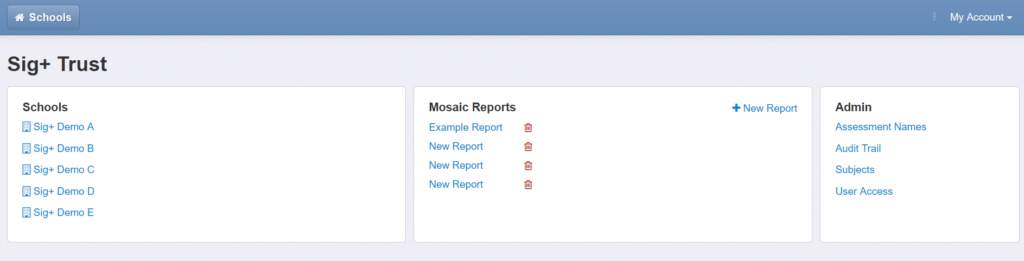
If you have trust access, when you log in, you’ll see a screen like this, with all your schools listed down the left hand side, and existing reports in the middle (note the ‘+ new report’ button). There are also some admin tools listed on the right hand side of the screen, which allow you to make changes to your MAT system.
Add a report
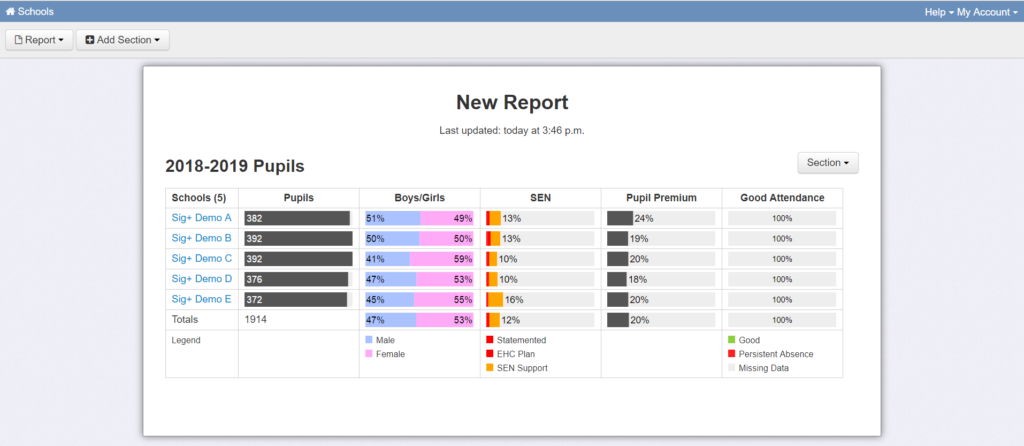
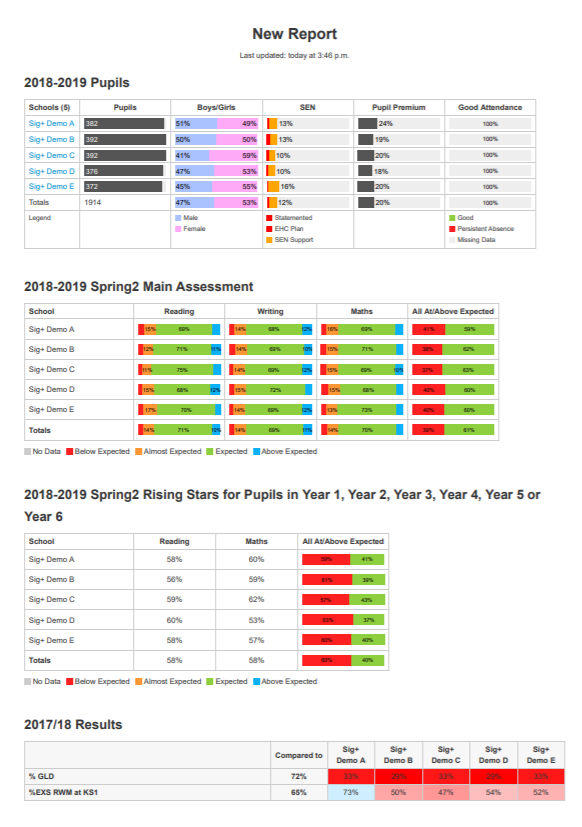
Now let’s click on the ‘+ new report’ link to start building our MAT report. Automatically, a context section is added showing attendance figures, and percentages of pupils in particular key groups for each school and for the MAT as a whole. You can click on the ‘section’ button and edit or delete this section if you like.
Add an assessment data section
We are now going to add a new section, which will display current assessment data. Click on the ‘add section’ button top left and choose the ‘other assessment’ option:
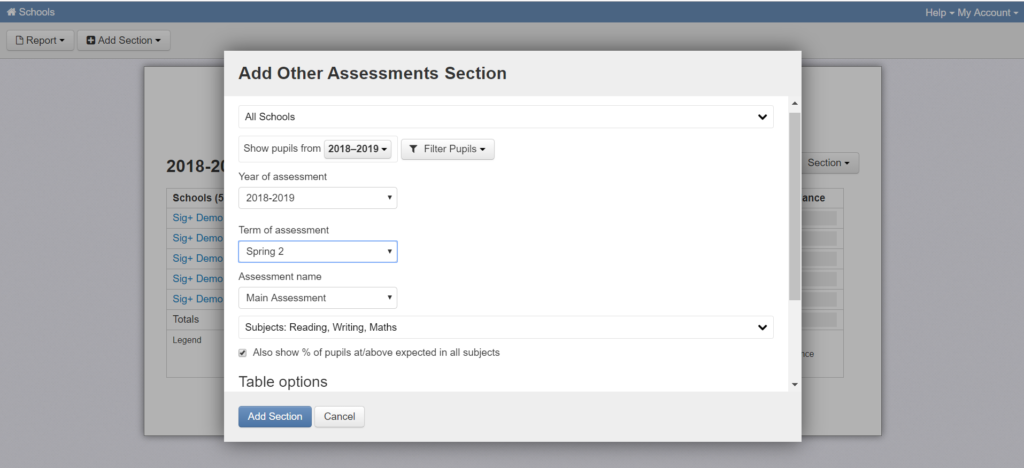
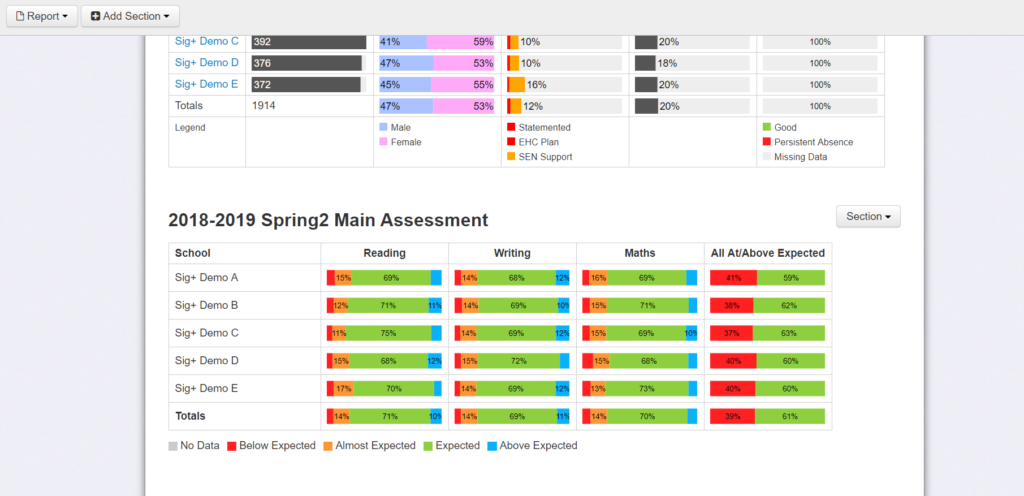
By default, all pupils in each school will be selected (i.e. the section will show data for all pupils in the school), but if you want to limit it to a particular year group, click ‘filter pupils – year groups’ and select the desired year group. Then select the term for which you want to show the data (I’ve selected Spring 2), and the type of assessment required (I’ve selected main assessment, which is where I store my ongoing teacher assessment). Then choose the subjects (I’ve selected reading, writing and maths); I’ve also checked the tick box for ‘% at/above in all subjects’ – this will show data for combined subjects. Further down, under table options, you can choose a format for your data: percentages or stacked bars. I’ve chosen stacked bars. Finally, click ‘add section’ and you should get a table like this:
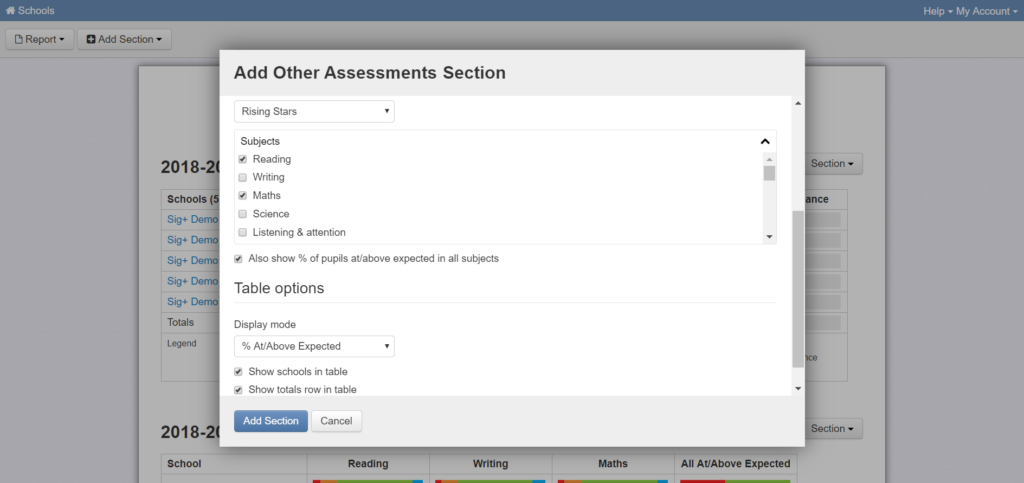
Now click ‘add section’ again and repeat the above process (i.e. add section – other assessments). This time we are going to add in data based on standardised tests. Here, in place of main assessment I’ve selected ‘Rising Stars’ and under subjects, I have chosen reading and maths only (but if you use a grammar test as well, you can add that. You can even add in data based on comparative judgement scores, if you have that in your MAT). This time I’ve chosen to display the data as percentages at or above instead of stacked bars. The threshold that defines ‘at expected’ is defined by the user, by the way.
Now, click ‘add section’ button and you should have another element added to your report:
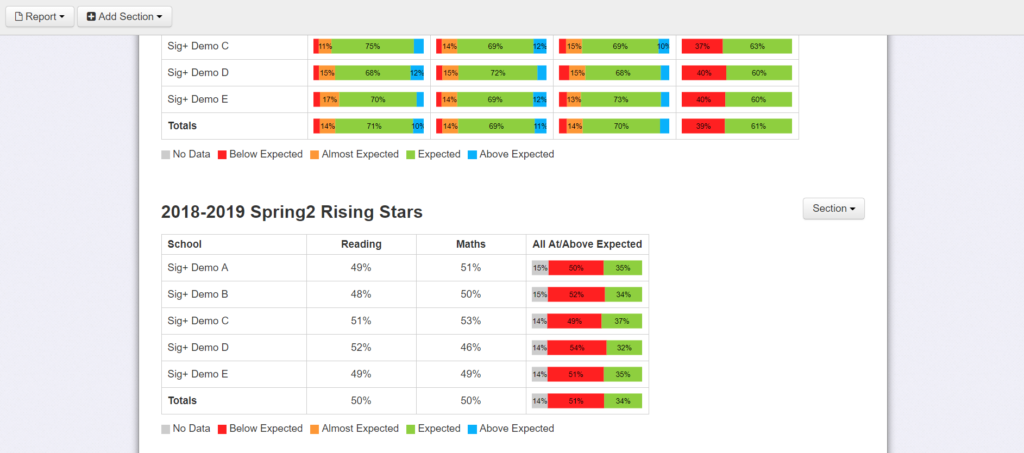
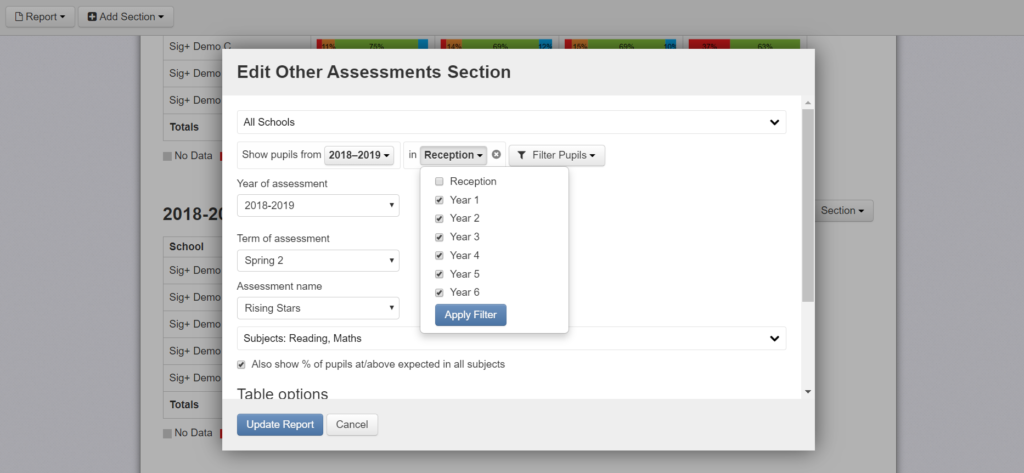
Note that the bar charts have a grey section, which represents the proportion of pupils with no Rising Stars test data. This is the reception class, and it would make sense to filter them from the results. To do this, click on the section button beside the table, and click ‘settings’. Then click the filter button, choose ‘year group’ option, and select all years groups except for reception. Then click ‘apply filter’ and select ‘update table.
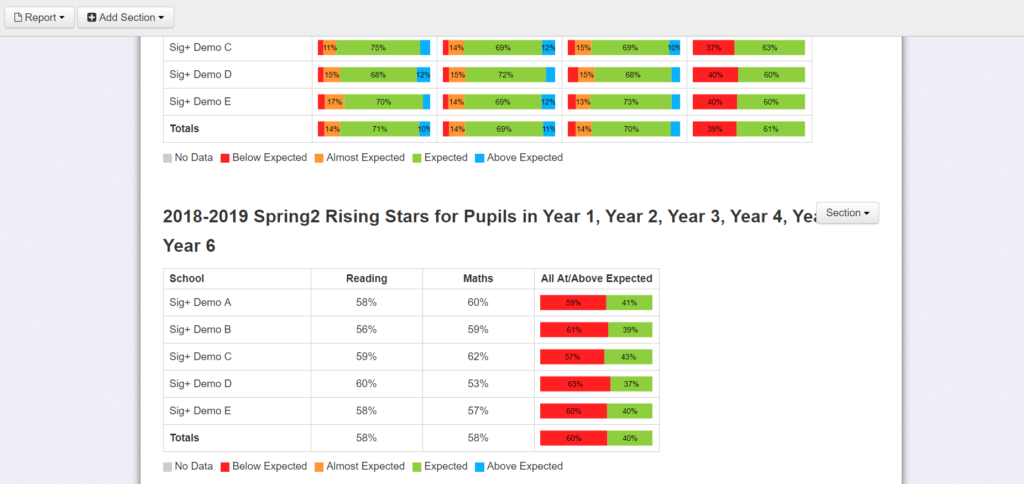
The grey portion is now gone.
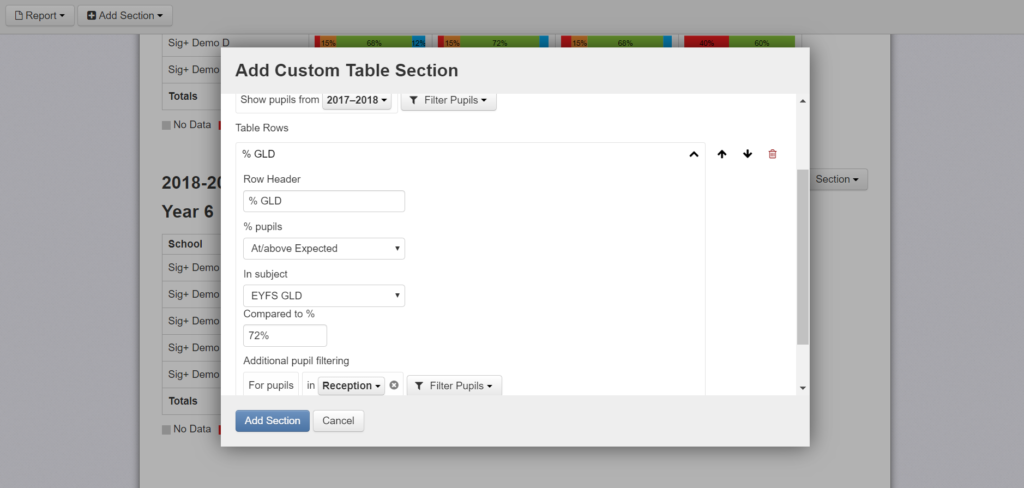
Finally, we’re going to add a custom table to display the results of statutory assessments from the previous year. Click ‘add section’ again, and select custom table. Here, I’ve selected 2017/18 from the dropdown because I want to show last year’s results. Then click ‘add row’ to start adding data. In my first row I want to show % GLD: I’ve named the row ‘%GLD’, selected EYFS GLD from the subject dropdown, added the national comparator of 72%, and added an additional filter for reception pupils.
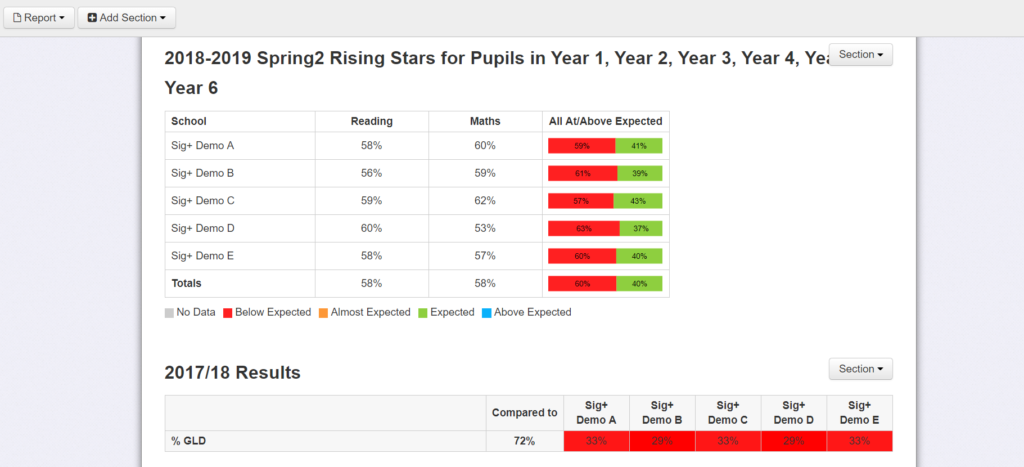
This generates a new table with % GLD for each school compared to national.
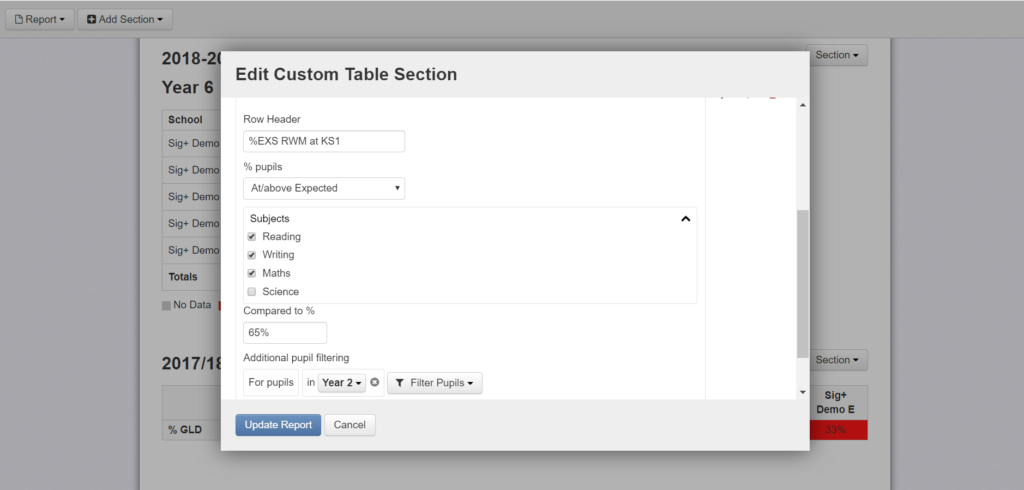
Finally, I’ll add in one more row for KS1 results. Click on the ‘section’ button, click settings, and add another row the the table. Here, I’ve selected reading, writing and maths to show the percentage that achieved expected standard in the three subjects combined. I’ve then added the national comparator of 65% (the percentage of pupils that achieved EXS at KS1 in 2018 in all three subjects, as shown in the FFT dashboard), and selected Year 2 from the additional filter at the bottom of the settings options.
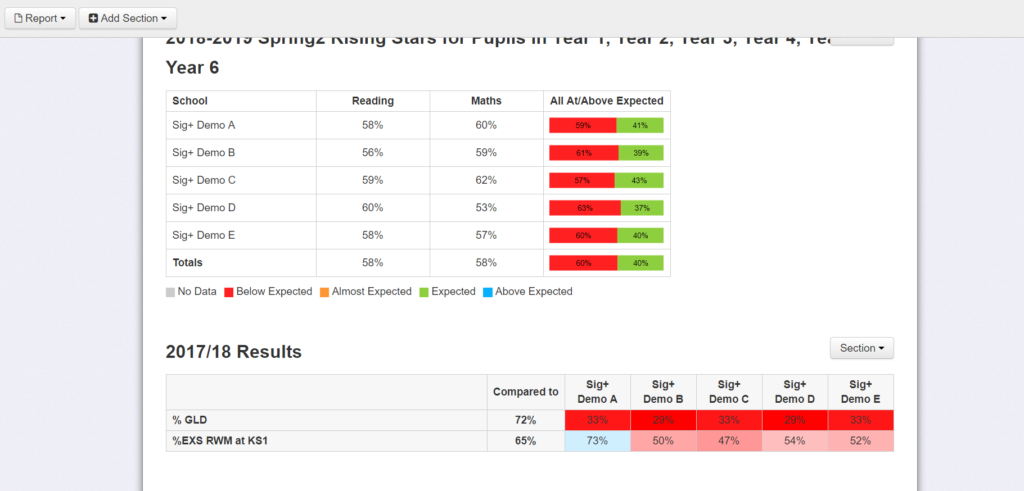
This then adds a new row to my report as follows:
I could, of course, continue to add rows to my table to show results in phonics, or at KS2 in individual and combined subjects. Next year, to bring my report up to date, I would simply change the year in the settings to 2018/19. Note that all data will be updated to reflect changes in pupils; just click on the ‘report’ button, top left, and select ‘refresh all sections’ to ensure the data is up to date. There is also an option to duplicate the report if you wanted to keep this one as it is and create a new one for the following year, or if you wanted one to show data for specific year groups. You can also opt to rename the report from the ‘reports’ button.
Once you’ve created your report, you can print it, or better still, print to pdf to save a copy:
I hope that demonstrates the power and flexibility of Insight’s Mosaic tool for MATs. If you are an Insight user in a MAT and would like to find out more, or if you are not currently using Insight but would like a demo or a free trial, please email [email protected] or tweet me @jpembroke.