Insight, like many tracking systems, allows users to record assessments against individual learning objectives. Schools using the full version of Insight can set up their own lists of objectives for any subject or intervention, and these can be edited, deleted or added to as required by the user. It is important to note that overall summative assessments in Insight – those headline judgements – are not the product of an algorithm based on how many objectives have been assessed; it is the teacher’s decision. We feel that’s important. But we also know that an increasing number of schools are moving away from using lists of learning objectives in their tracking systems, or never went down that route in the first place, and consequently require a far simpler approach. That’s why we’ve brought out Insight Essentials.
Insight Essentials offers the following:
- Live link to MIS via Assembly
- Make overall, summative teacher assessment up to four times per year (entry, autumn, spring, summer) in any subject (‘point in time’ assessment only. Essentials does not support steps or flightpaths).
- Upload all other forms assessment data (scaled and standardised scores, raw scores, reading ages, EYFS month bands, custom assessments) either manually or via the quick excel tool.
- Ability to set custom thresholds for test scores to define assessment bands
- Import FFT benchmarks
- Access to a suite of customisable, fully interactive reports including new Headlines report, progress matrices and Venn diagrams
- Bespoke MAT reporting via the Mosaic tool
Data Entry
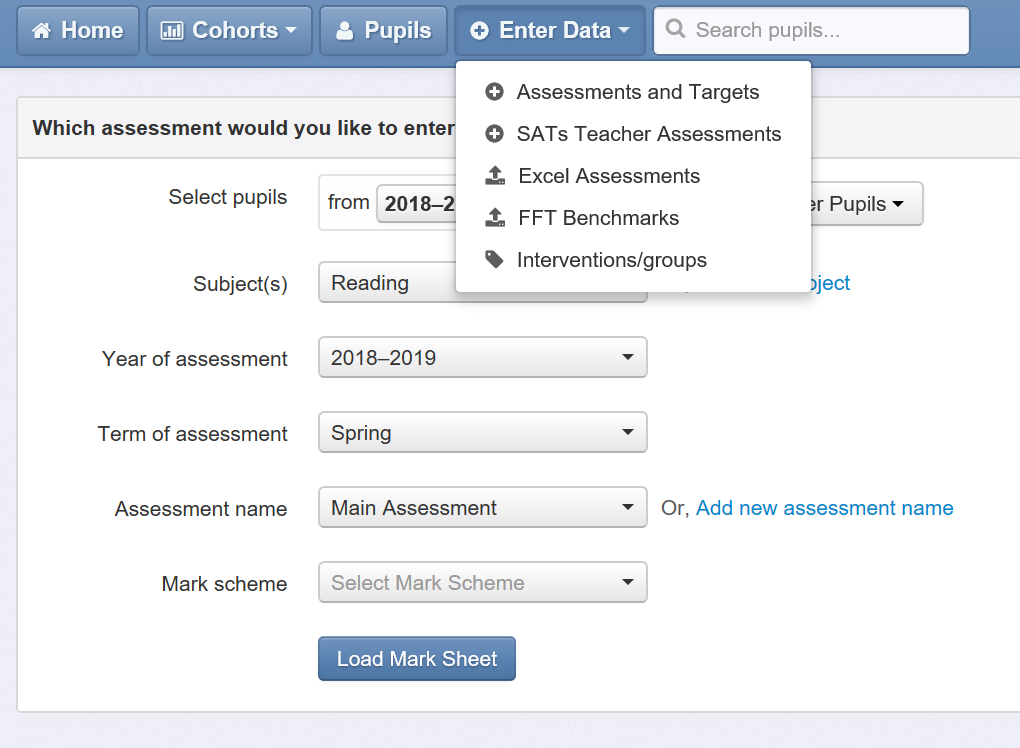
The data entry tool provides a number of options. ‘Assessments and targets’ allows users to manually enter all sorts of data via the screen visible behind the dropdown (see screenshot above): teacher assessment, standardised scores, reading ages, percentiles, development matters bands, phonics results, p-scales and pre-key stage standards. Users can create new subjects and assessments at the click of a button, and in the unlikely event that your data is not catered for by an existing mark scheme, we can quickly create it for you. ‘Excel assessments’ is a really clever tool that allows you to literally copy and paste an entire year group’s data onto the screen. It is an incredibly quick way of uploading test scores from a spreadsheet. ‘FFT benchmarks’ is Insight’s FFT upload tool. Simply select the level of challenge in FFT (you can import FFT50, 20 and 5 if you like), export the csv file from FFT Aspire for each year group, and import it at the click of a button. It takes seconds. And finally, ‘interventions and groups’ allows users to create any pupil groups they like.
Pupils
Each pupil has their own page in the system and any time you see a pupil’s name in a report, you can click on it to reach their page. Here’s an example:
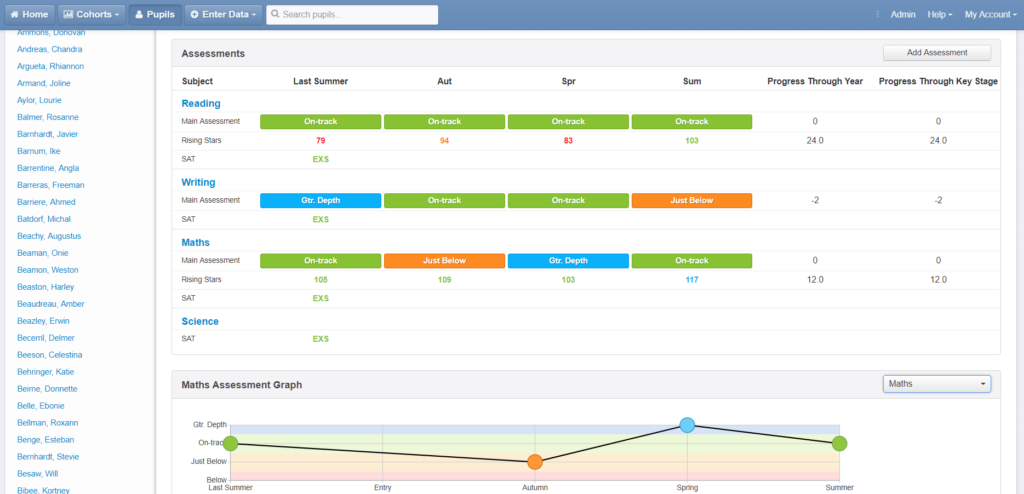
Note that it displays the overall teacher assessment for each term as well as other data, for example standardised scores or prior attainment. Additional data can be added to the profile using the ‘add assessment’ button. You can also easily click back and view previous years’ data. There is also a comments field and a facility to upload attachments. All pupils are transferred from the school’s MIS either automatically or via a CTF file. This will also transfer all pupil groups’ data and prior attainment (KS1, phonics and EYFSP).
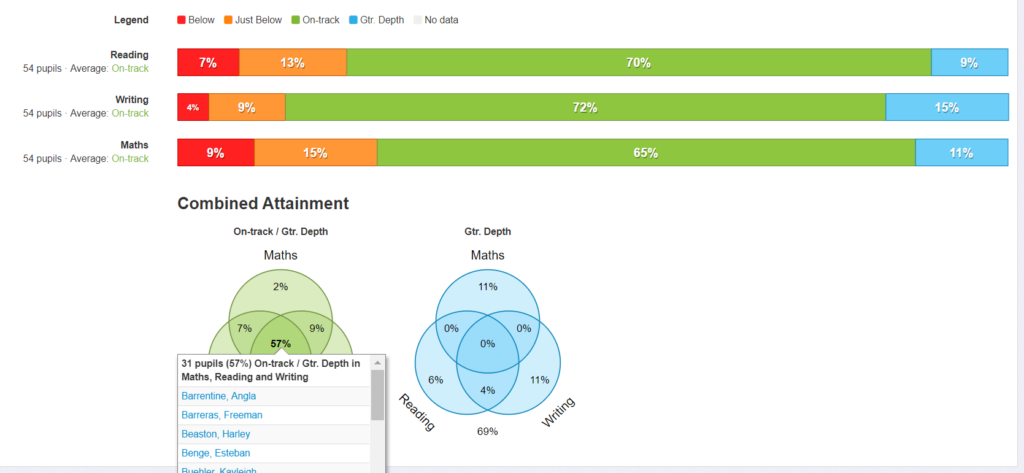
Cohorts
All reports are accessed via the cohorts button. The simplest report is the attainment overview, which shows percentages well below, just below, at and above expectations in all subjects assessed and provides venn diagrams for two and three subjects combined. Bar charts and Venn diagrams are interactive: they reveal names when clicked on, and can be grouped by pupil characteristics. Cohorts can be compared if more than one year group is selected.
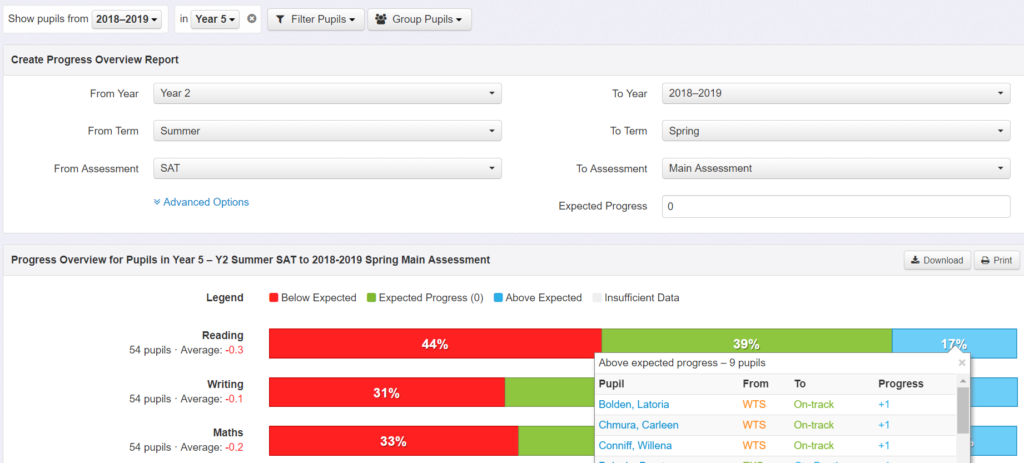
Our next report is the progress overview. Select a start point and an end point, the assessment data you want to use, and the subjects you want to include and the report will show the pupils that have improved, those that have broadly stayed the same, and those that have declined. The example below compares current teacher assessment to pupils’ KS1 result. Alternatively we could use EYFSP as a start point and a standardised test result as our latest assessment, or compare current assessment to an FFT estimate to get an idea of who’s on track for end of key stage targets.
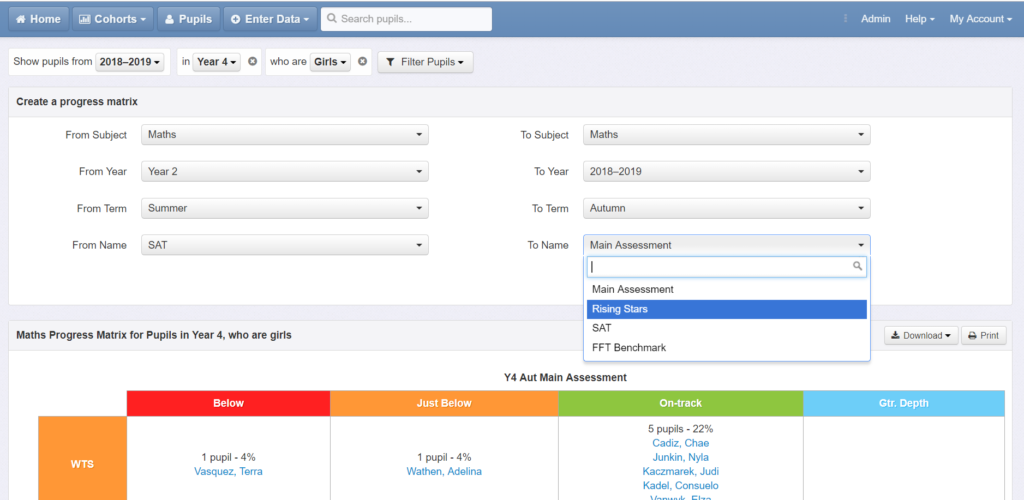
Next up is the progress matrix. Similar to the above report, we select any start and end point, but this tool plots the individual pupils on a grid. Matrices can be used to plot current attainment (eg teacher assessment or standardised score) against prior attainment (eg a previous year’s assessment, or a statutory result from KS1 or EYFSP). We can also use matrices to compare current teacher assessment to a test score, or assessment in one subject against another. They are incredibly intuitive, simple, and quick to build, and very popular for pupil progress meetings. Like all other reports they can be easily filtered, and pupil names are interactive. The following screenshot shows the set up options.
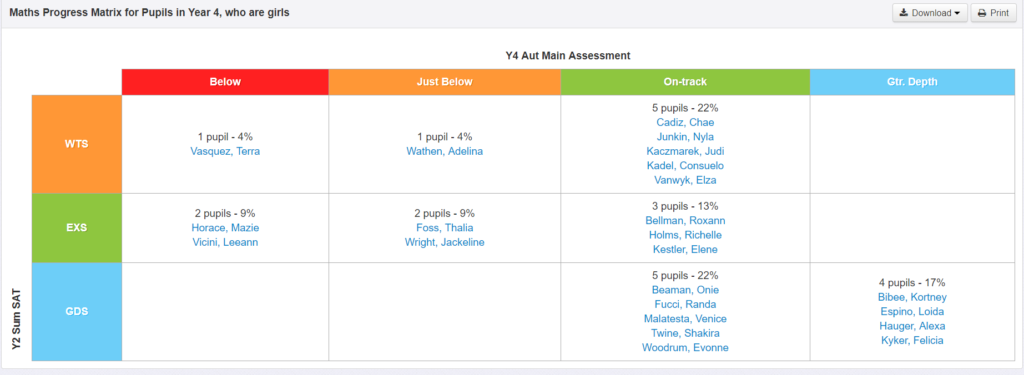
This builds a report that compares KS1 result to current attainment in reading for girls in Year 4.
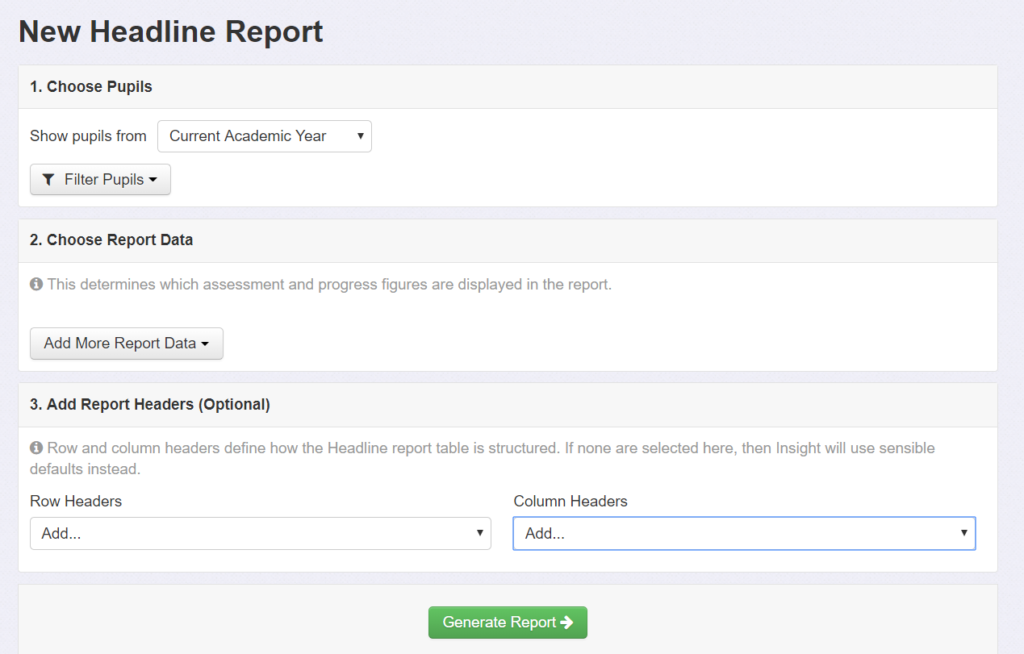
Next up is the new Headlines report. This tool allows users to custom build a report by selecting various data, and then choosing how they want it presented. Multiple year groups and data aspects can be selected, and rows and column contents can be easily defined.
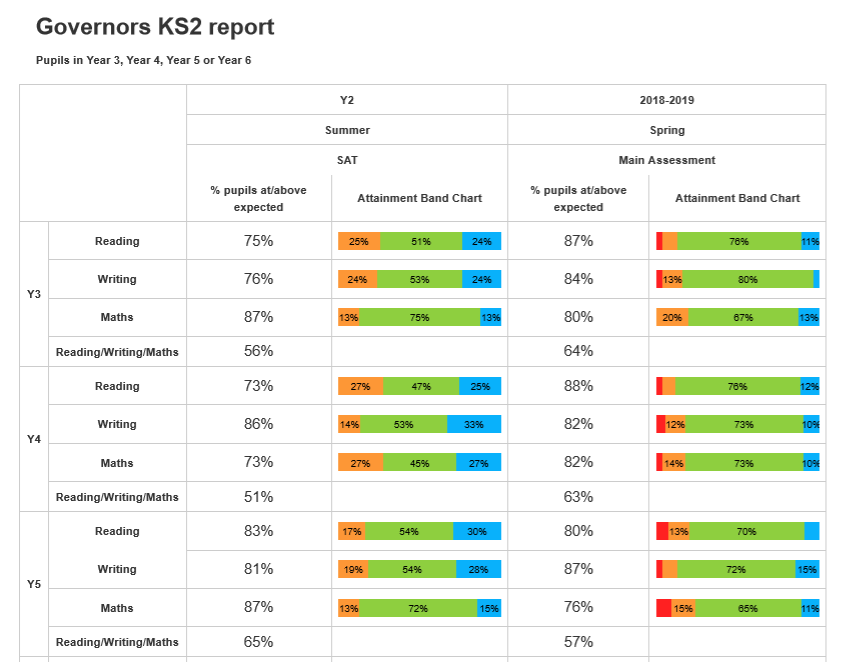
Here’s an example report, which compares current attainment of KS2 cohorts back to their KS1 outcomes. Like all reports, these can be printed or exported to PDF.
And finally we have ‘Tables’, a clever tool, which allows users to build a table of data from scratch by adding in any columns of data they need and grouping it in any way required. If you’ve ever spent hours (or days) transferring data from multiple sources into your own templates then this tool is the answer. Build it once, never do it again.
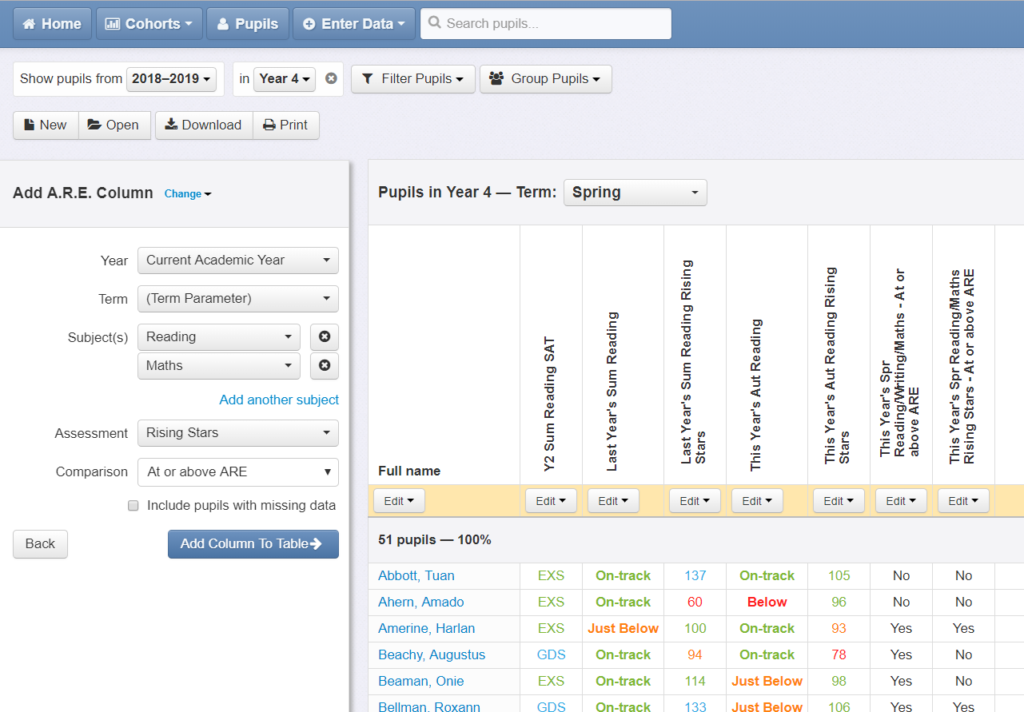
The above screenshot, showing a table containing KS1 results, recent teacher judgements, standardised scores and a combined subject assessment, is obviously at pupil level, but at the click of a button it can be aggregated to a key group report:
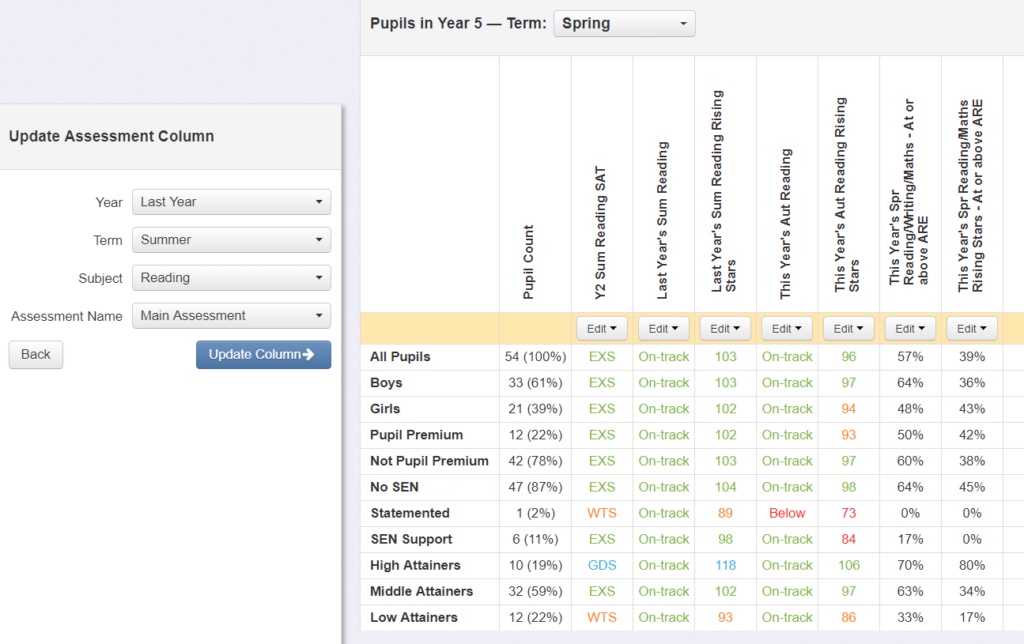
Or you could select the whole school and group by year group and by key group to cover all bases. Once you have built the table, you can apply it in any way you like, whenever you like. It saves a huge amount of time.
I hope that gives you an idea of what Insight Essentials can do. For more information and a free trial, go to insighttracking.com, or tweet me @jpembroke.