One of the frustrations of ASP is the use of different national comparators for the various pupil groups. The comparator is shown in the national column in the data tables, accessed by clicking the ‘explore data in detail’ link anywhere in the ASP system, and the comparator type can be found by clicking on the question mark beside each group. There are three categories: ‘same’, ‘other’, and ‘all’, which are defined as follows:
- Same: the group is compared to the national figure for the same group e.g. boys in the cohort compared to boys nationally
- Other: the group is compared to the national figure for the opposite group e.g. disadvantaged pupils in the cohort are compared to ‘other’ (i.e. non-disadvantaged) pupils nationally.
- All: the group is compared to the overall national figure for all pupils e.g. SEN pupils are compared to overall national figures.
I understand the thinking behind comparing disadvantaged pupils to non-disadvantaged pupils (i.e. closing the gap; I still can’t quite bring myself to use the phrase ‘diminishing the difference’) but knowing the national figures for disadvantaged pupils is useful, especially if you fall in that grey zone between the two results. As for comparing the SEN pupils to overall national figures for all pupils, I really can’t get my head round this. Clearly, here there is a need to know the national figures for SEN.
So, how do we find this data? We can download it from the DfE Statistics site, but we have to wait a few months from getting results before we get the release that contains results by pupil characteristics. The KS2 data is due on 14th December and KS4 will not be out until 25th January. Fortunately, if you use FFT Aspire, you can access the data much earlier. Here’s how.
1) Login to FFT Aspire, click on ‘self evaluation’ and click ‘attainment and progress’

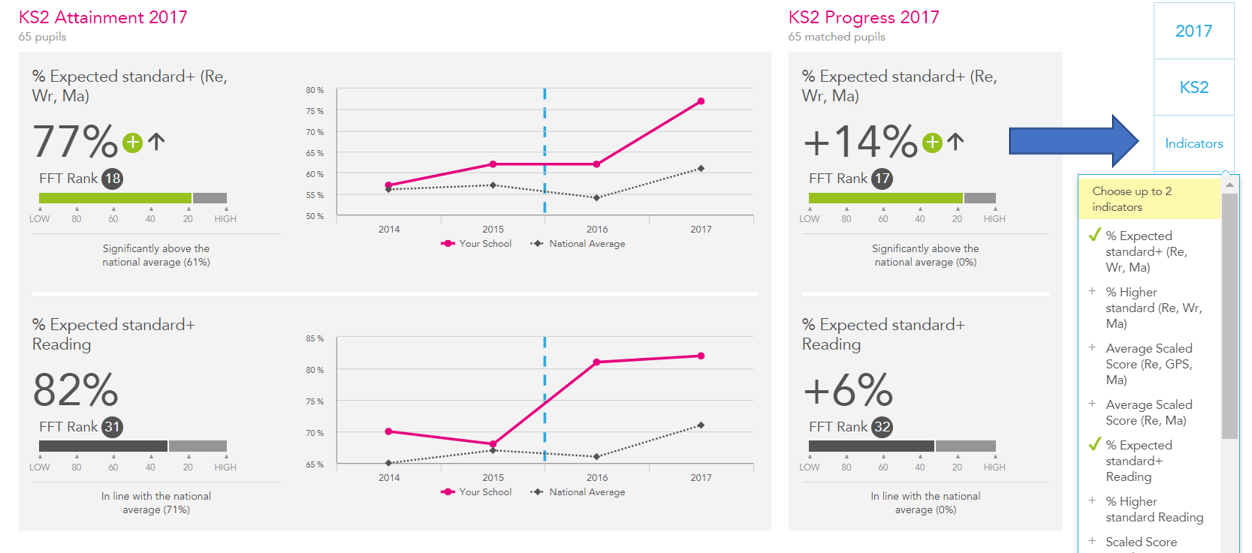
2) Select the indicator that you are interested e.g. % Expected standard reading. To do this click on indicators, uncheck one of the existing selections, and select the desired indicator.
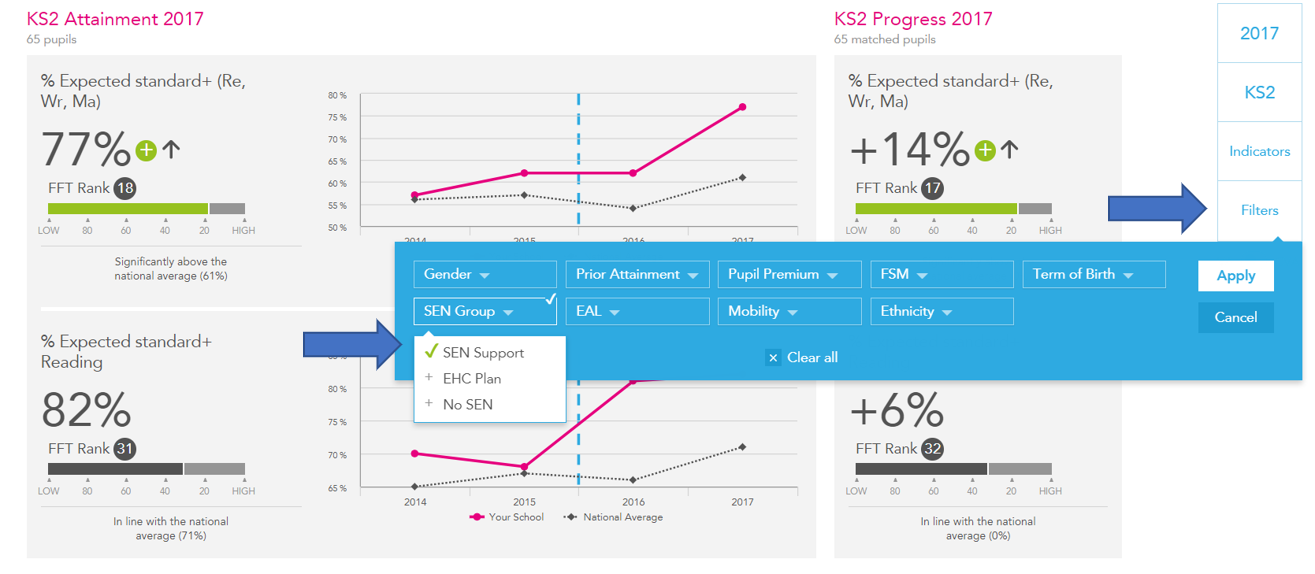
3) Now select the group you are interested in, e.g. SEN Support, by clicking on filters and selecting the desired group
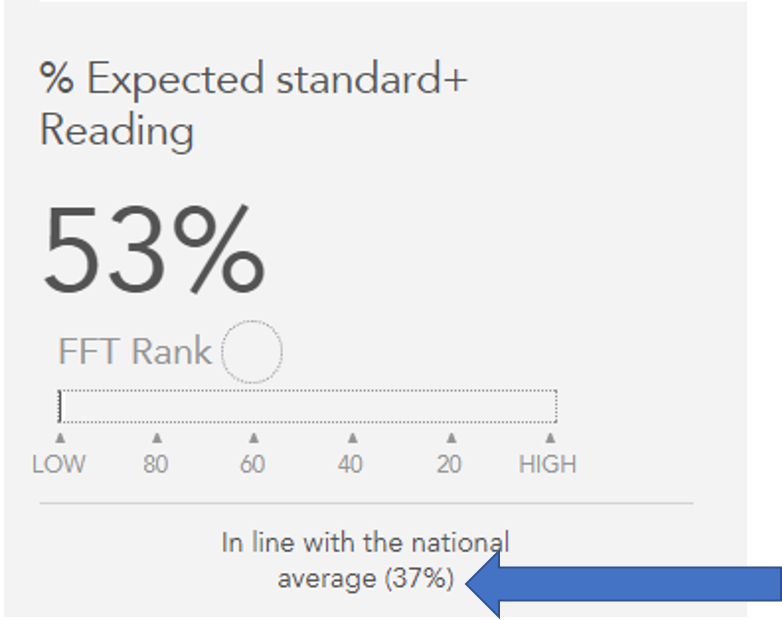
4) Note the change in the national figure beneath the school result (i.e. under the main indicator graphic in large font o n the left)
Congratulations! You have now found the comparable national figure in FFT.
Note that in this example, 37% of SEN support pupils achieved the expected standard in reading in 2017. In ASP, SEN Support are compared against the overall national figure of 71%. A huge difference.
That’s why it’s definitely worth knowing how to find this data.