The SATS results are out and many schools are feeling utterly dejected. Our tracking systems told us everything would be OK and we confidently gave predictions to governors, staff, LAs and others, of results that would at least be above floor. But then Tuesday happened and not even the country as a whole came close to floor standard. Almost half of pupils nationally did not meet the expected standard and schools are left reeling. Almost as soon as the scores were downloaded from NCA Tools, teachers were on twitter discussing progress measures:
1) How will progress be measured this year?
2) What will the floor standards for progress be?
3) How can we measure progress now?
The answer to the first question is: it will be a VA measure calculated like this – pretty much identical (in concept) to VA calculations of previous years.
The answer to the second question is: we don’t know. They will certainly be negative; and now it seems they’ll be very negative if the DfE really only wants a 1% point increase in the number of schools below floor.
The answer to the third question is: we can’t. We have to wait until the autumn term for the VA scores to come out in RAISE. But that’s not going to stop schools and others (I’m looking at you LAs and Academy chains) from having a go now.
So, here are the three things that schools are going to attempt in advance of the real data being published. Three things that are pointless and most likely to be at odds with the official VA data; that are likely to cause further confusion and pain down the line, but that schools will do anyway.
1) Attempt to calculate VA
Surely we all understand how VA work by now. It involves comparing each pupil’s KS2 score against the national average score for similar pupils (similar in terms of prior attainment based on KS1 APS). So, if you wanted to have a decent stab at it, you will first need to know the national average scaled score for each of these start points:
| 3 | 8 | 11.5 | 15 | 18.5 |
| 4.5 | 8.5 | 12 | 15.5 | 19 |
| 5.5 | 9 | 12.5 | 16 | 19.5 |
| 6 | 9.5 | 13 | 16.5 | 20 |
| 6.5 | 10 | 13.5 | 17 | 20.5 |
| 7 | 10.5 | 14 | 17.5 | 21 |
| 7.5 | 11 | 14.5 | 18 |
According to my calculations, using the new KS1 APS formula, those are the discrete APS outcomes derived from all possible combinations of W, L1, 2c, 2b, 2a, L3 for reading, writing and maths at KS1. We need to know the national average KS2 scaled score outcomes for each of those 34 prior attainment groups (more if we throw L4 into the KS1 mix). No one knows these figures at the moment. And even if we did, there are shrinkage factors to take account of school size, and no doubt other coefficients to consider as well, none of which we know right now. So what might some try instead?
First, they might just compare each pupil’s KS2 score to the overall national average score of 103. That is not VA; that is relative attainment. It is not a progress measure. You are not comparing pupils against an appropriate benchmark linked to start point. It is meaningless. A non-starter. Don’t do this.
Second, you might work out the ‘in-school’ average score for each start point and compare each pupil to that. Well, nice try and on the right track (it at least demonstrates awareness of VA methodology) but there is one major floor: you will always get the same outcome: 0. I know people have tried this in the past (had that conversation) and a headteacher actually emailed me some LA guidance this week that suggested schools do this. Seriously, don’t.
2) Subtract KS1 APS from KS2 score
As certain as death and taxes, give people a start figure and an end figure and they’ll subtract the former from the latter. I bet people are doing this right now: subtracting KS1 APS from KS2 scaled score, and then inventing arbitrary thresholds to define ‘expected’ and ‘more than expected’ progress. Do you have a 2b pupil who achieved 107 in their maths test? Simply subtract 15 from 107. They’ve made 92 points of progress. That’s excellent! Another only made 88 and fell short of the 90 point good progress threshold. Hmm, less than expected.
That’s Numberwang! (credit: @simonraz 🙂
3) Invent a progress matrix
We all love a progress matrix. I know I do (seriously, I do). So let’s invent one now. First we start with the assumption that all 2b pupils should achieve scores of 100+. But what about the others? The L1, 2c, 2a and L3 pupils? Time for some arbitrary thresholds I reckon. To save you all the hassle of creating a progress matrix yourself, I’ve made one up for you:
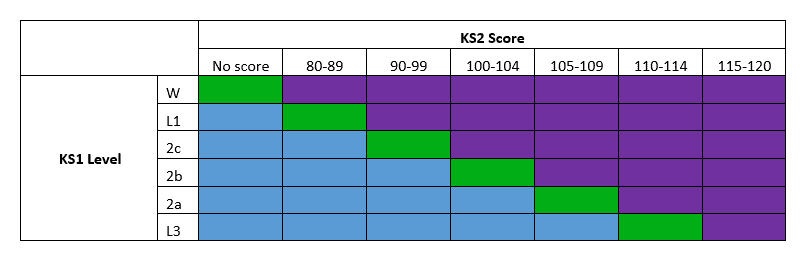
It’s so simple to use and easy to understand. What can possibly go wrong? Feel free to copy and fill out to present to SLT, Governors, SIPs, LA officers, Ofsted inspectors and that chap from academy head office. I guarantee they’ll love it.
But I guarantee one other thing, too: none of this will bear any relation to the real VA data when it’s published.
so why bother?