This study stems from a request sent to Gloucestershire primary schools, asking for key stage 1 test scores alongside pupils’ teacher assessments with the aim of ascertaining the average and range of scores for the three main teacher assessment bands: working towards the expected standard (WTS), working at the expected standard (EXS), and working at greater depth within the expected standard (GDS). 30 primary schools responded with data for 900 pupils in total, which provided a good sample for this study. Each school submitted a spreadsheet, listing individual pupil test scores in the appropriate columns labelled WTS, EXS and GDS. There was a tab for reading and a tab for maths. One interesting observation is that whilst most schools have some pupils assessed as EXS despite having scores below 100, in a number of schools this was not the case. In these schools, no EXS pupils had scores below 100. Further analyses of results are below.
Reading
1) Working Towards the expected standard
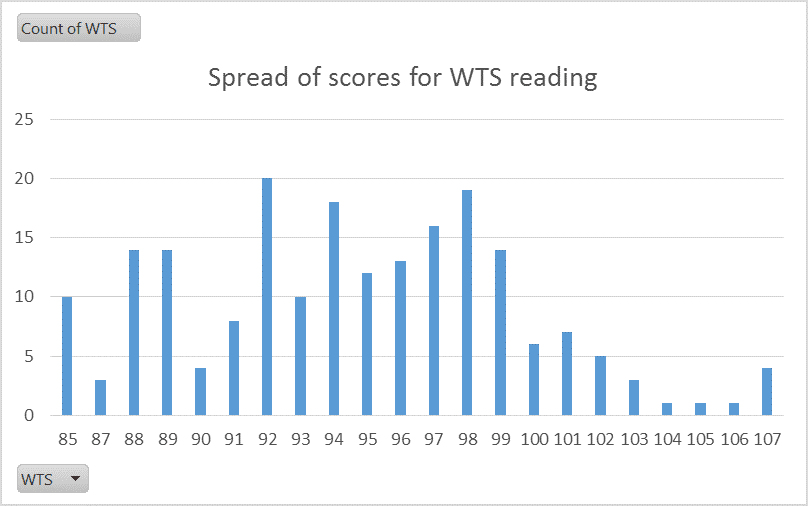
The above chart shows the distribution of scores for pupils assessed as working towards the expected standard in reading. The data is far from normally distributed and has a number of peaks, most notably associated with scores of 92, 94 and 98. There is a sharp drop in frequency after 99, which is to be expected as 100 represents the expected standard, but there are still 28 WTS pupils with scores of 100 or more. The key data is as follows:
No. pupils: 203
Median: 95
Median: 95
Mean: 95
Mode: 92
Range: 85-107
2) Working at the expected standard
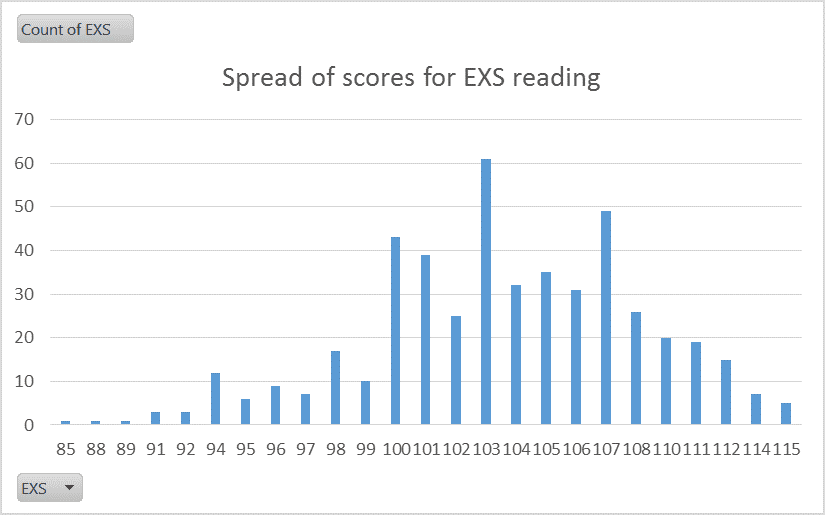
There is a very wide spread of scores for pupils working at the expected standard. The above chart shows two prominent peaks associated with scores 103 and 107, and there is a distinct threshold at the 100 scaled score point, which is perhaps to be expected. The wide range is interesting and raises questions about the relationship between tests and teacher assessments. Key data is as follows:
No. pupils: 477
Median: 104
Median: 104
Mean: 104
Mode: 103
Range: 85-115
3) Working at greater depth within the expected standard

This data reveals a sudden increase in frequency at 107, which suggests this scale point represents a threshold between EXS and GDS in the case of reading. Following a dip in frequency at 108 there is a steady increase towards the peak at 115. There is also an interesting overlap around 107 across the three teacher assessment bands for reading (see WTS and EXS charts above). Key data is as follows:
No. pupils: 212
Median: 111
Median: 111
Mean: 111
Mode: 115
Range: 99-115
Maths
1) Working toward the expected standard
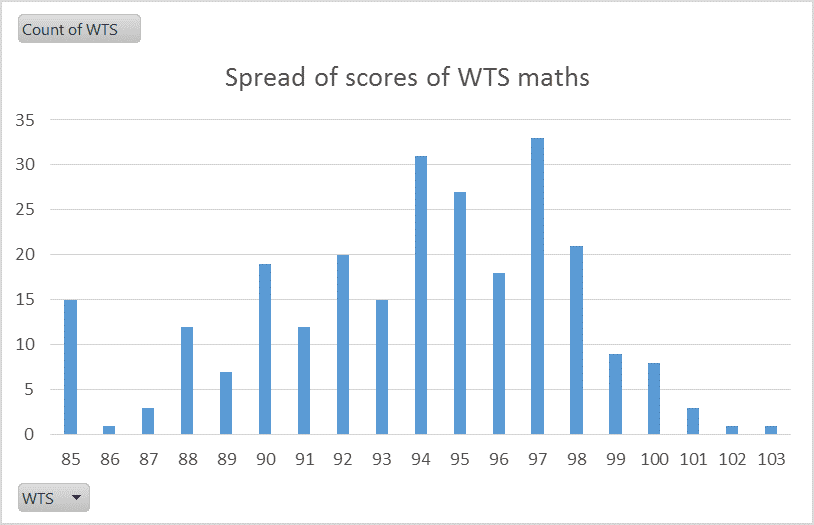
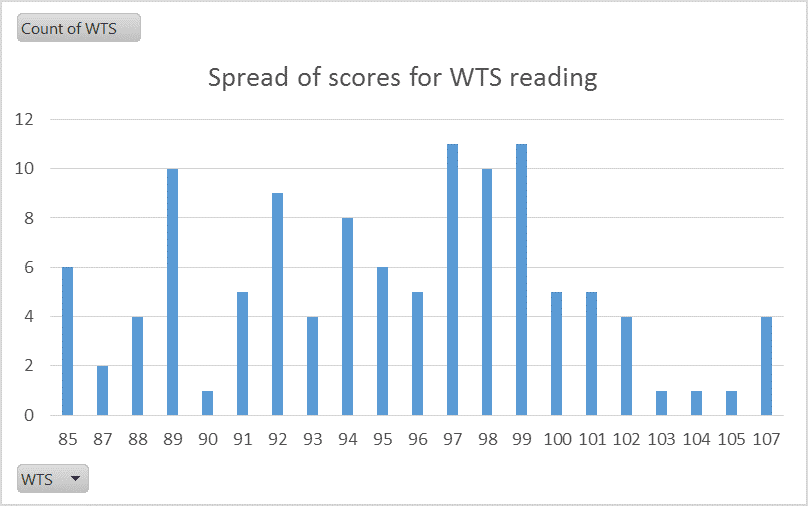
There is a narrower spread of scores here than for WTS in reading, and two peaks are revealed: a prominent peak at 97 and smaller one at 94. There is an overall steady increase in frequency towards 97 followed by a steep drop as 100 (expected standard) is approached. Key data is as follows:
No. pupils: 256
Median: 94
Median: 94
Mean: 94
Mode: 97
Range: 85-103
2) Working at the expected standard
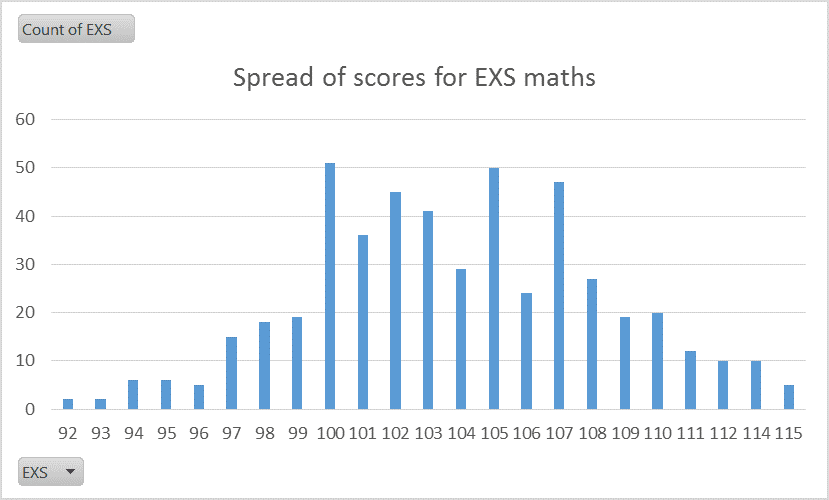
As for WTS, there is a narrower range of scores for EXS in maths compared with reading – no pupils were assessed as EXS in maths with scores below 92. Once again there is a sharp increase in frequency associated with 100, which suggests that score is influencing the EXS assessment, and there are further peaks at 105 and 107. This data set is closest to a normal distribution. Key data is as follows:
No. pupils: 499
Median: 104
Median: 104
Mean: 104
Mode: 100
Range: 92-115
3) Working at greater depth within the expected standard
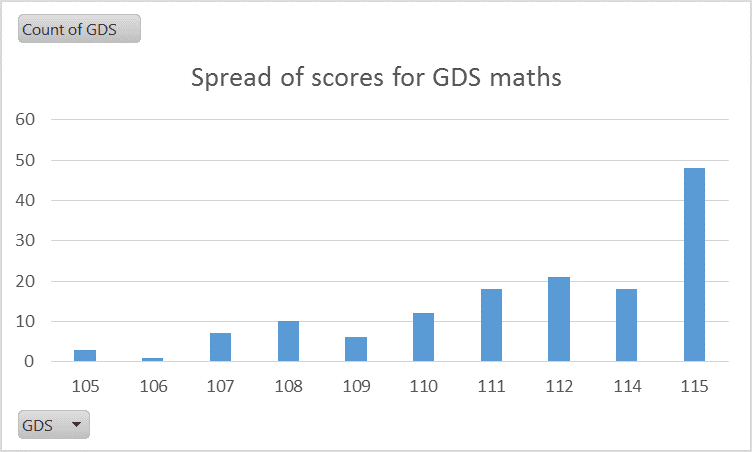
There are notably fewer pupils assessed as GDS in maths compared with reading (144 vs 212) and and here we do not see the sharp increase in frequency at 107, but a more steady increase from 105 to 114. As for reading, there is a prominent peak associated with the maximum score of 115. There is also a narrower range here than for GDS in reading. Key data as follows:
No. pupils: 144
Median: 112
Median: 112
Mean: 112
Mode: 115
Range: 105-115
Summary
It is difficult to draw conclusions from this study other than the perhaps unsurprising link between the EXS judgement and the 100 scaled score outcome. The comparison of the spread of scores for GDS in reading and maths is interesting, with 50% more pupils being assessed as GDS in reading and a apparently greater likelihood of receiving that assessment with lower test scores. In maths, on the other hand, it seems that there is a stronger relationship between the GDS assessment and the highest scaled score (115). Finally, the wide range of scores associated with the EXS assessment questions the extent to which the test scores inform the teacher assessment but, as mentioned above, the 100 scaled score is evidently an influencing factor in some cases, possibly for those ‘borderline’ pupils. It is also evident that some schools have only awarded an EXS assessment if the pupil has attained a score of 100 or more, but this is not the case in most schools. It must be stated that this study is based on a sample of 900 pupils and perhaps more data is required if reliable conclusions are to be drawn. Hopefully the data is of interest and will provide some useful comparisons with your own data.
Many thanks to those Gloucestershire Primary Schools that kindly volunteered their data during this very busy time of year. Much appreciated.