Understandably there is a great deal of confusion about how the DfE can calculate VA once the current assessments are replaced in 2016 with new tests that give scaled scores. But we know that a VA measure will exist – it will be centred on 0 rather than 100 – and will be one of 4 key performance measures at key stage 2. It is important to understand that VA does not require data in compatible formats at either end of the measure, just as long as you have a measure at the start and finish.
VA is a measure of progress that compares a pupil’s attainment against a national average for pupils with the same prior attainment. It has nothing to do with levels of progress. Prior attainment could be in sublevels, scaled scores, fruit, woodland mammals, or shades of grey (maybe not the latter). Here’s an example: a series of 10k races is held across the country, with runners wearing one of three vests: red for slower-paced runners, green for medium paced runners, and blue for faster runners. You could then compare the race times of a runner wearing a green vest against that of the average green-vested runner nationally. If they beat the time then they have a positive score; if they meet it, their score is 0; if they fall short, their score is negative. That’s sort of how VA works.
It’s worth noting that FFT already measure progress from EYFS to KS1 using the same methodology: they compare a pupil’s key stage 1 result against the national average outcome for pupils with the same prior attainment at EYFS. No conversion of EYFS data to APS takes place; it’s not necessary. In fact it’s a bit of a fallacy that KS1 and KS2 data was ever in the same format: one was a teacher assessment whilst the other was a fine grade converted from a test score.
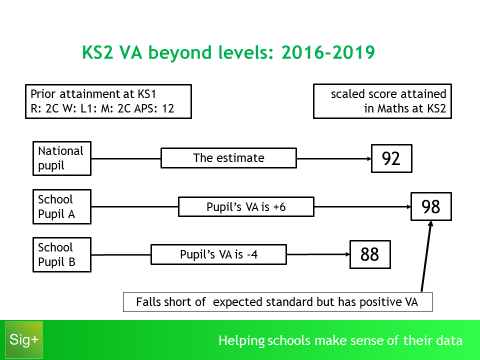
So, what happens after levels? Well, same thing really: we compare a pupil’s key stage 2 scaled scores against the national average scaled score for pupils with the same prior attainment at key stage 1. I’ve put together the following diagram to explain this:
In this example, pupil A is +6 and pupil B is -4; the average VA for this (admittedly small) sample is therefore +1 ((6 + -4)/2). More importantly, it should be noted that Pupil A has exceeded the VA estimate, and has a positive VA score, despite not having met the expected standard. Conversely, it is possible for a pupil to meet or exceed the expected standard but still end up with a negative VA score if their scaled score is lower than the national average score of pupils with the same start point.
Hope that helps to clear up some of the confusion surrounding this issue.