The latest VA calculator can be downloaded here
Now in its fourth year, I thought I’d write a blog about my VA tool, which many schools use to calculate VA and to help with target setting. The original version came about in 2012 for two reasons:
1) I discovered, whilst giving a talk on RAISE to secondary maths subject leaders, that I understood far less about VA than I thought I did, and
2) I used the RAISE KS1-2 Pupil ready reckoner tool (which can be downloaded from the RAISE library) and it was awful.
I am now a self-confessed, fully subscribed, card holding VA nerd.
The problem with the RAISE tool is that you can only calculate VA for one pupil at a time. Before adding the next pupil’s data, you have to delete the previous one. A bit of a pain. So, I set about pulling the ready reckoner apart and building the formulae and coefficients into an easy to use spreadsheet. I now produce two versions for KS2. Both calculate estimates from KS1 baselines in the same way, but one version calculates VA using test scores so is intended for Year 6 who have actual KS2 results. The other calculates potential VA using end of KS2 predictions in the form of sublevels, in place of test scores, and is therefore more approximate. Here, I’ll deal with the latest version, which calculates VA for Year 6 using their test scores (and teacher assessment for writing). It uses 2015 level thresholds and 2014 coefficients (more on that below).
This first screenshot shows the VA calculator with KS1 results added for 8 Y6 pupils. You can see the calculated APS estimates, equivalent sublevel and expected progress (i.e. the progress required to reach the APS estimate and thus get a VA score of 100).

The estimates are based on average progress made by pupils with the same prior attainment nationally in the same year. This is where this tool has its limitations, because we are always one step behind, using methodology from the previous year (2013 in this case). We won’t have the 2014 coefficients until the ready reckoner tool is released in the autumn alongside RAISE.
What shocks some schools are those estimates where expected progress exceeds 14 points. You can see a few examples above; and pupil 4 has to make over 15 points of progress in reading to reach their estimate (i.e. to make VA 100). It is clear that many are unaware of this, believing that pupils need to just exceed 12 points progress to get a positive VA score; and evidently some Ofsted Inspectors also make this mistake, as the following anecdote reveals. A head teacher I know decided to use the VA calculator to set targets in their school. KS1 data was entered for all pupils in KS2 (Years 3-6) and estimates calculated. The HT then decided to set targets by going a sublevel above the estimate, thus ensuring they were aspirational and aiming at a high positive VA score. During the inspection the HT showed the spreadsheet to the inspector, who studied it, look confused, and asked “so, does it just add on 12 points, then?” I think the HT quite enjoyed explaining how VA worked to the inspector. If you want to know more about KS2 VA, please read my blog on the subject.
This next screen shot shows the KS2 results added and VA calculated for individual pupils.
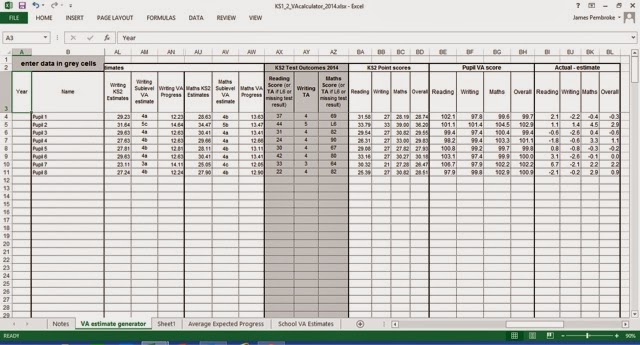
The spreadsheet converts the test scores (and writing TAs) to points scores. These are then compared against the estimates and the difference calculated (see end columns for differences). The differences are then added to 100 to produce individual VA scores seen in columns BE to BH.
I must point out that the VA for the cohort is not the average of the individual VA scores. This is what an inspector, looking at this spreadsheet, told an HT recently but it’s not quite as simple as that. This average figure is known as the ‘unshrunken VA score’. It doesn’t not take account of the size of the cohort and therefore does not allow for fair and reasonable comparison of schools’ VA scores. The following table, contained in the School VA estimates tab of the VA calculator, calculates both the unshrunken and the shrunken VA scores. It is the latter that is added to 100 to give the final scores for the cohort.

Note that the tool also provides the confidence interval and the significance if any. In this example, all VA is deemed to be in line, which means that pupils are making broadly the same amount of progress as pupils with the same prior attainment on average nationally. This school’s maths VA score of 101 is probably enough for a larger school to be significantly above, but using the confidence interval given above we can see that this cohort would need a VA score of 101.8 in maths to be sig+.
Quick rant about writing: writing estimates are as refined as those for reading and maths yet the actual end point is a whole level, based on a teacher assessment. Most pupils will therefore gain a point score of 21 (L3), 27 (L4) or 33 (L5). If the pupil has an estimate of, say 29 points (a 4A) then they need to get a L5 in writing in order to gain a positive VA score (+4). A level 4 in writing would mean they were 2 points short of VA. This is not the case in reading or maths where they can get a positive VA score by getting an extra mark or two in the test. The example above has three pupils with 4A writing estimates, all of whom got a L4 teacher assessments. Each of these ends up more than 2 points short of their estimates. A VA measure that compares an up obtainable fine grade estimate against a whole level point score seems unintuitive to me. Consequently, I don’t have a great deal of faith in writing VA.
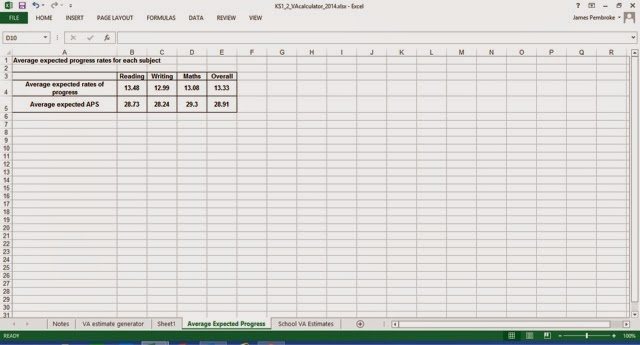
One more screen shot to show you. This one simply works out the average estimated APS and expected progress rate for each subject, thus giving the user an idea of what the cohort needs to do, on average, in order to get past the VA 100 line.
So, that’s it. It’s a useful tool, free to anyone who wants it (click link at top of this page) and should give you a very good idea of VA in advance of RAISE, so, could be useful if you are inspected before October/November (whenever RAISE is published).
And next year we can look forward to a whole new world of VA fun. I can’t wait.
Happy calculating!